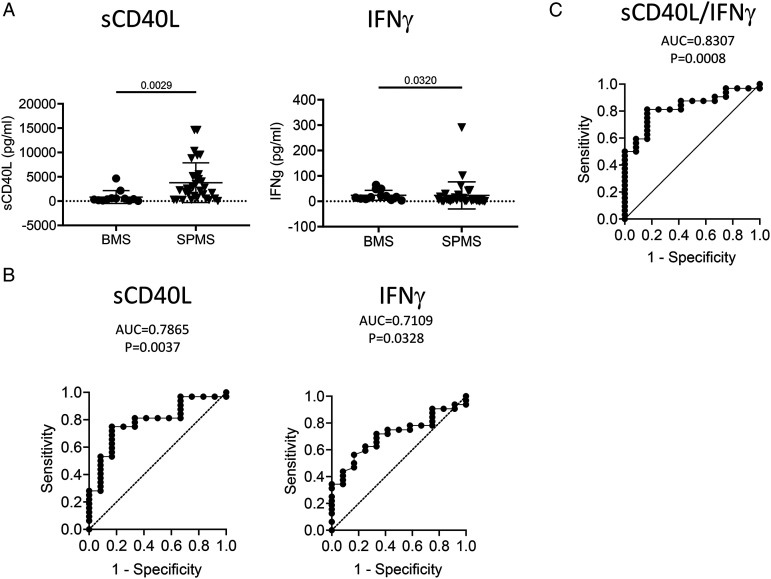
Figure 5.
Plasma levels of sCD40L and IFNγ discriminate SPMS from BMS. Plasma concentration of sCD40L and IFNγ in BMS and SPMS patients were compared along with their ROC plots. (A) Column scatter graph of plasma concentrations of sCD40L and IFNγ derived from BMS and SPMS patients. P value using Mann–Whitney test are shown above the line. (B) ROC analysis using plasma concentrations of sCD40L and IFNγ derived from BMS and SPMS groups. (C) Multiple logistic regression analysis combining plasma concentration of sCD40L and IFNγ derived from patients of both BMS and SPMS groups. n: BMS = 12, SPMS = 32. ROC, receiver-operating characteristic; AUC, area under curve.

