Figure 6.
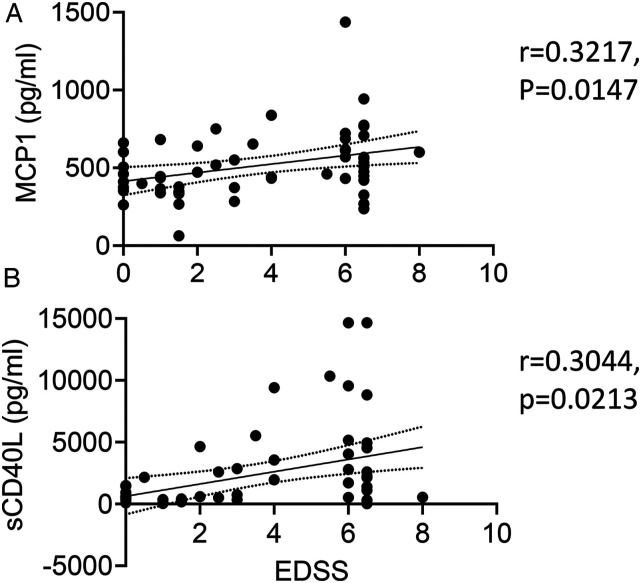
MCP1/CCL2 and sCD40L are significantly correlated with MS disease progression. Spearman correlation analysis was performed using plasma levels of MCP1/CCL2 (A) and sCD40L (B) against corresponding EDSS scores in all participants. r is the Spearman correlation coefficient. The solid line is the best fit line of linear regression with 95% CI (dotted line).

