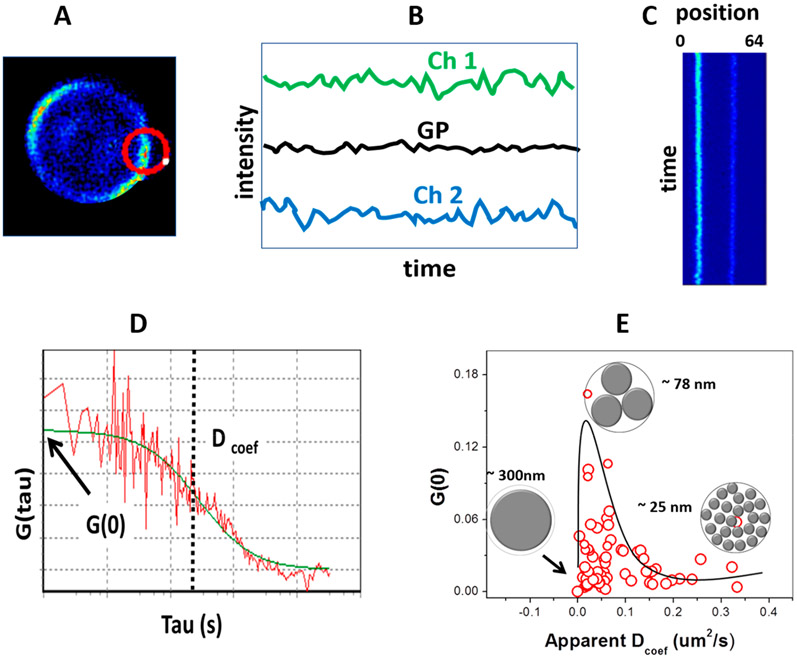
Figure 3.
LAURDAN GP and scanning FCS. (A) Scanning FCS in rabbit red blood cells stained with LAURDAN at 37 °C with laser scanning in a circular pattern. (B) Two channels (440 and 490 nm) were acquired to obtain the GP trace. (C) GP trace data were transformed in an x–y representation (each orbit over time). Locations corresponding to the membrane were analyzed by autocorrelation giving G(0) and diffusion coefficient Dcoef (μm2/s) for several red blood cells. (D) Autocorrelation analysis. (E) Plot of G(0) versus Dcoef, showing the structures responsible for the fluctuations with sizes of 300, 75, and 25 nm.

