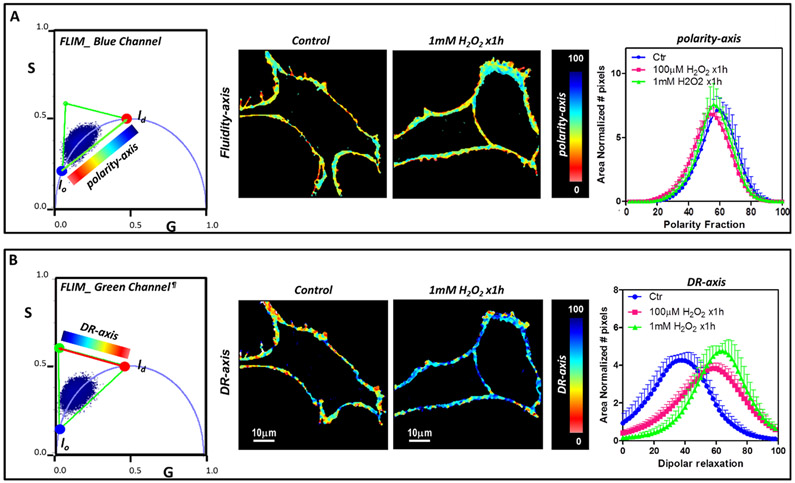
Figure 5.
FLIM phasor three component analysis for the effect of H2O2 in NIH-3T3 cells. H2O2 treated versus nontreated cells were compared. (A) Analysis for the blue channel. A color palette for the polarity-axis was used to obtain the corresponding figures (middle panel) and histogram of polarity fraction (right panel). (B) Analysis for the green channel. Images were generated using the coloring scheme shown in the phasor plot for the dipolar relaxation axis and the histogram for the dipolar relaxation enables quantification of the effect of H2O2 (right image). For both analysis cell images were masked to analyze pixels from the plasma membrane. lo and ld refer to liquid order and liquid disorder environments, respectively. We note that dipolar relaxation may bring phasor points outside of the universal circle due to the additional phase shift.

