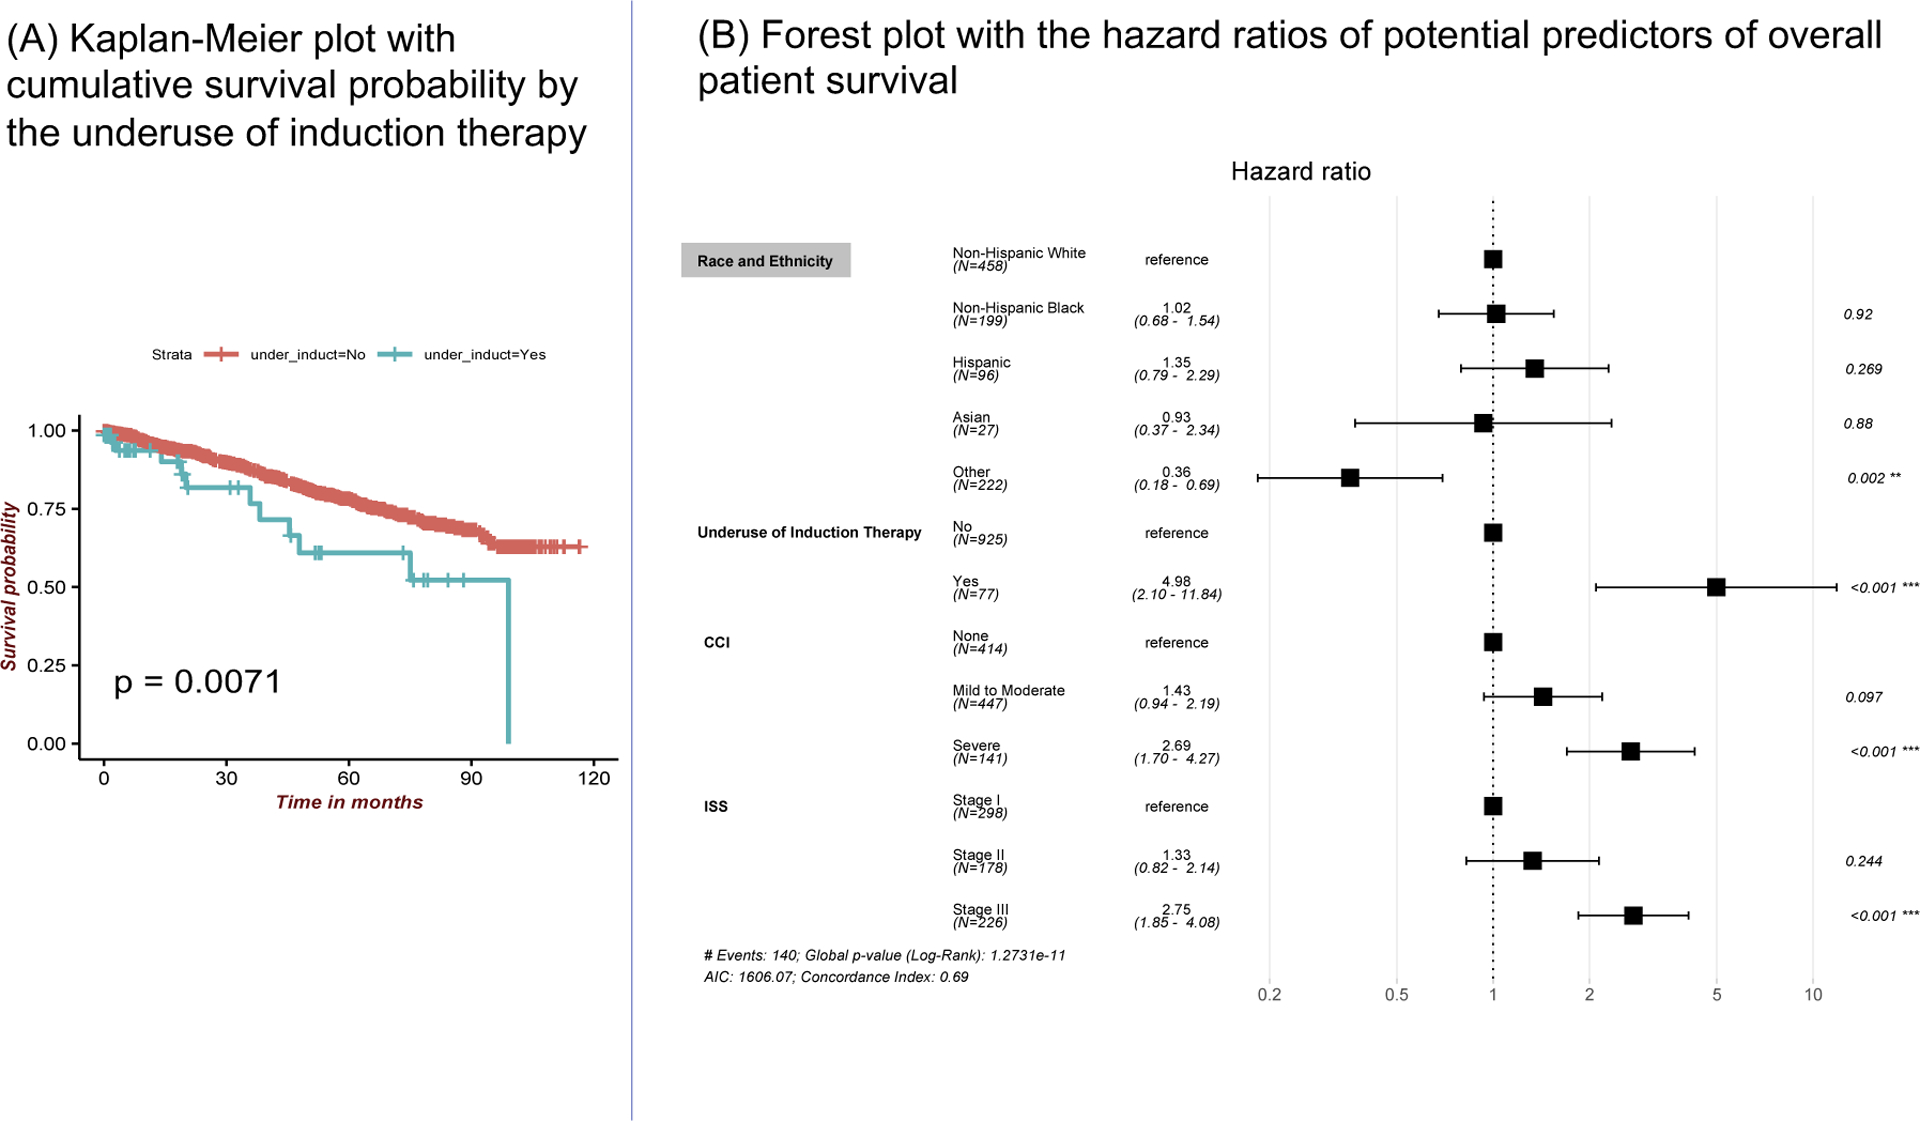
Figure 3:

Results survival analysis: (A) Univariate Kaplan-Meier plot shows the cumulative probability of patient survival by the underuse of induction therapy. (B) Results of the multivariate Cox proportional hazards model of overall patient survival displayed as a forest plot with hazard ratios for underuse of induction therapy, race and ethnicity, ISS staging and Charlson comorbidity index. (ISS: international staging system; CCI: Charlson Comorbidity Index categories)
