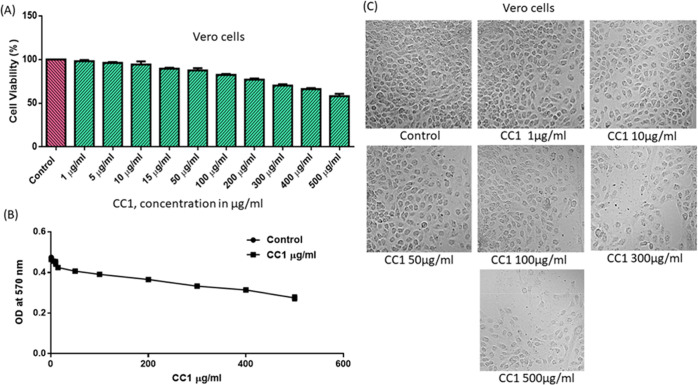
Figure 6.
Effect of CC1 on Vero cell viability. (A) Cell viability; a high viability (>80%) up to 100 μg/mL (363.4 μM). (B) Representation of a dose–response curve with IC50 119.3 μg/mL (431.9 μM). (C) Morphological observation of Vero cells with different concentrations under a phase-contrast microscope, exposed for 48 h. The control value was taken as 100%, and the data were presented as means ± SE from three independent experiments.

