Figure 8.

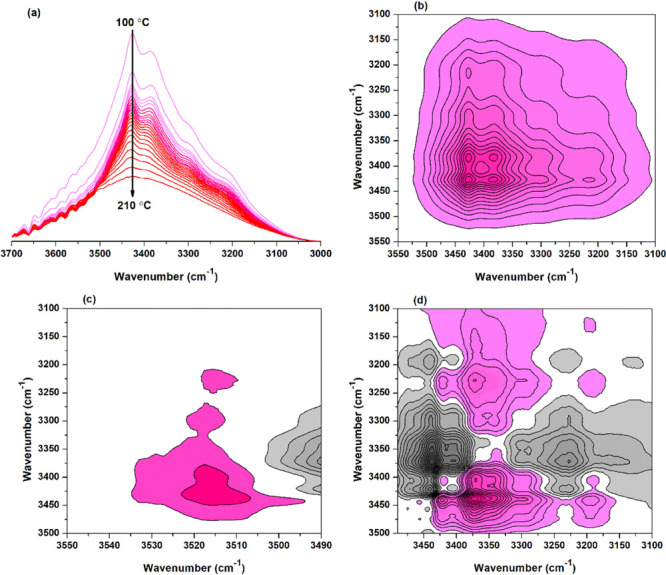
FTIR spectra and 2Dcos maps of cellobiose and BTCA mixture between 100 and 210 °C: (a) FTIR spectra; (b) 2Dcos synchronous map; and (c,d) 2Dcos asynchronous map.

FTIR spectra and 2Dcos maps of cellobiose and BTCA mixture between 100 and 210 °C: (a) FTIR spectra; (b) 2Dcos synchronous map; and (c,d) 2Dcos asynchronous map.