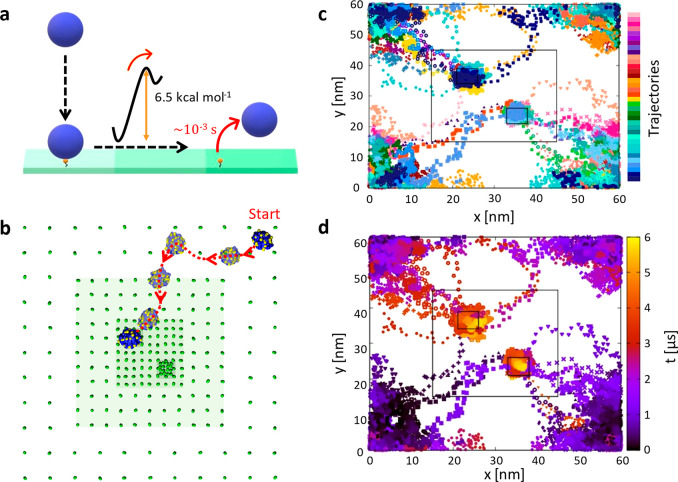
Figure 4.
Submolecular fCG models of NP chemotaxis. (a) Free-energy barrier (∼6–7 kcal mol–1) and characteristic escape time scale (τ ∼10–3 s CG) for fCG-NP unbinding from the surface in the case of a monovalent interaction. (b) Example of CG-MetaD trajectory extracted from the ensemble of panels (c) and (d). (c) 36 trajectories of fCG-NPs on the surface from 36 multiple-walker CG-MetaD simulations (each color represents a different CG-MetaD run). (d) 36 multiple-walker CG-MetaD trajectories shown in panel (b), colored based on the simulation time (dark blue to red and yellow). In all CG-MetaD runs, the fCG-NP is seen to move from the lowest to highest-receptor density regions on the surface over time.

