Figure 10.
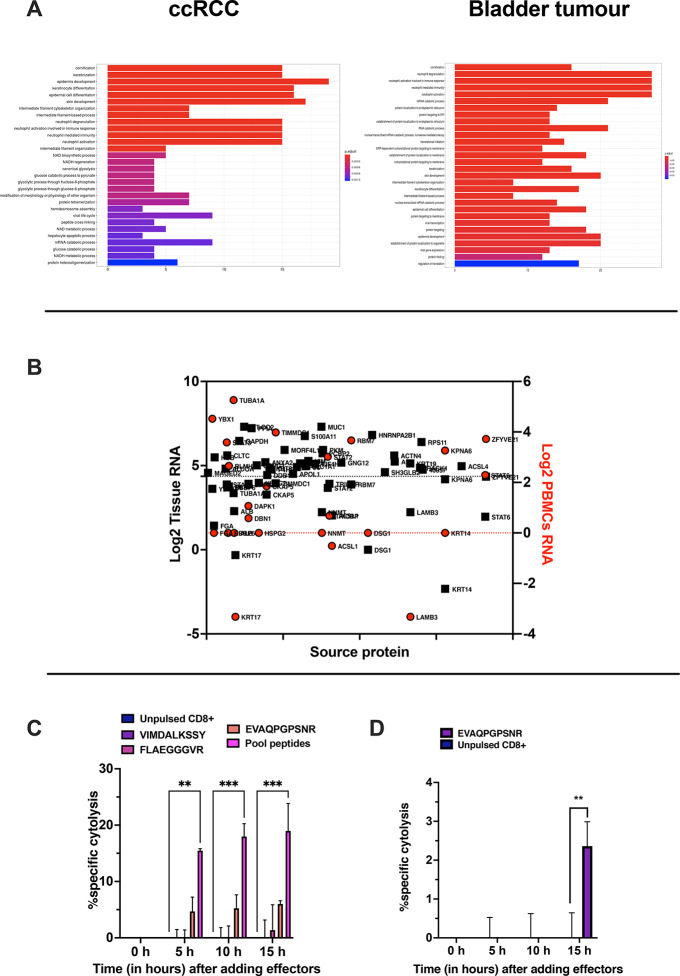
Assessment of the immunopeptidomic profile in PDOs. (A) Gene ontology enrichment analysis. The most overrepresented biological processes for RCC (left panel) and bladder (right panel) PDOs are shown (hypergeometric test padj <0.01) (B) The source proteins expression is depicted as log2 of the RNA level in healthy kidney tissue (black square) and in blood PBMCs (red circle). The 1st quartile is indicated as black and red dashed line, respectively, for the healthy kidney tissue and blood PBMCs. (C) PBMCs from healthy donors or (D) PBMCs from a patient were pulsed for 9 days with the indicated peptides, and at day 10 CD8+T cells were isolated and used in an in vitro killing assay at E/T 1:1. The time-response is shown after adding the effectors. The data are shown as the mean ± SEM, and the significance was assessed by 2-way ANOVA, ****p < 0.0001, ***p < 0.001, **p < 0.01, *p < 0.05. The results are plotted as bar graph (n = 2).

