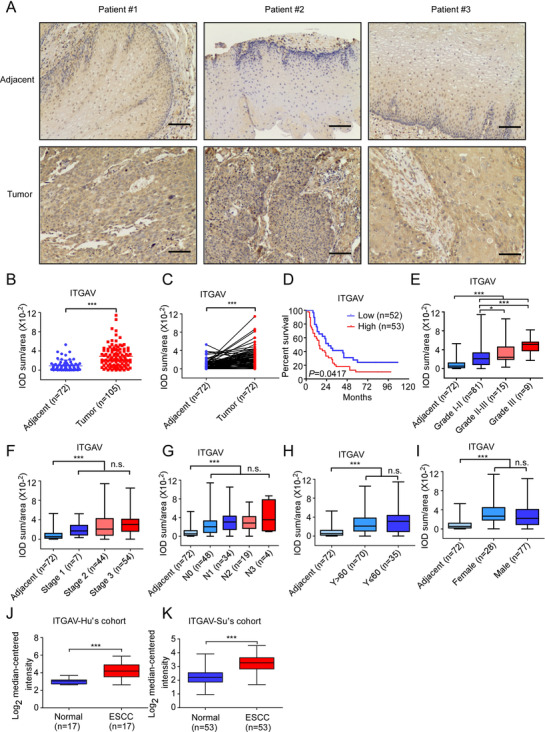
FIGURE 1.

ITGAV is highly upregulated in ESCC. (A) Representative images showing ITGAV expression in clinical tissues (100× magnification). Scale bar: 50 µm. (B) ITGAV protein levels in ESCC and adjacent tissue samples were assessed by IHC. The integrated optical density (IOD)/area × 10−2 was calculated using Image‐Pro Plus 6.0 software. (C) Quantification of ITGAV expression in paired samples. (D) Kaplan–Meier analysis of the overall survival of 105 patients with ESCC, stratified according to ITGAV protein level (high or low). (E–I) ITGAV protein levels in the tissues of ESCC patients grouped by tumour grade, tumour stage, lymph node metastasis, age, and sex. (J and K) ITGAV mRNA levels were compared between ESCC tissues and normal tissues in multiple patient cohorts. The original data were retrieved from the Oncomine database and plotted. *: p < 0.05; ***: p < 0.001. Data are presented as the mean value ± SD (error bar)
