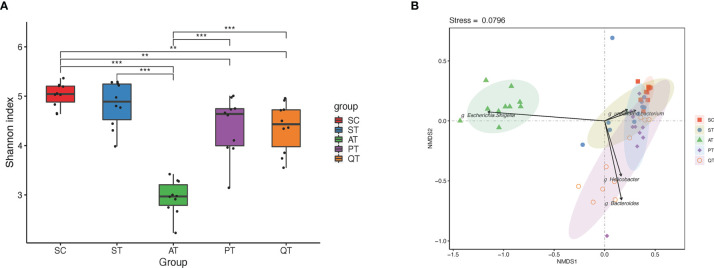
Figure 1.
Microbiota diversity and Non-metric multidimensional scaling (NMDS) distribution in five groups. (A) The microbial diversity in the AT group was significantly lower than that in the PT and QT groups. (B) NMDS analysis, the gut microbiota samples from AT group showed an individual feature and separated far from that of the other groups, while the other groups shared partly with each other. **, and *** stand for the FDR-value <0.01, and <0.001, respectively.

