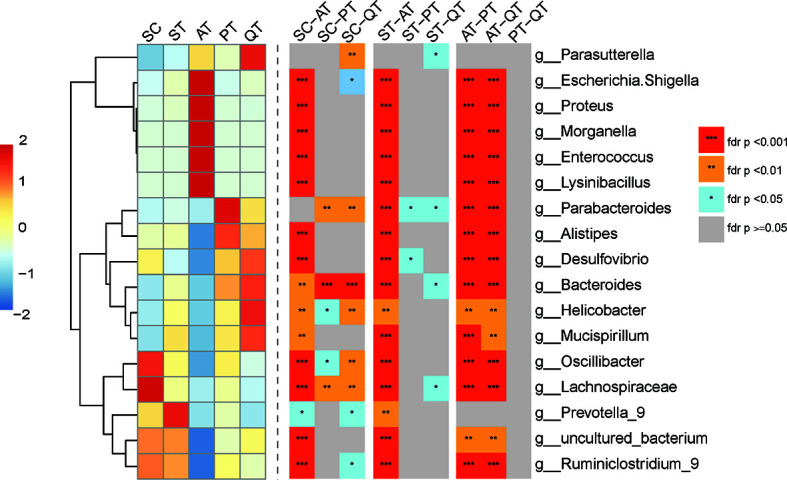
Figure 3.

Heatmap of top seven species abundance and compositional differences of cecum content from five treated groups across the genus level. (Left) Abundance distribution of dominant 16 genera (Y-axis) across SC, ST, AT, PT, and QT groups (X-axis) were displayed, which were arranged along the x-axes based on hierarchical clustering. Red represents the genera with high abundance in the corresponding treated groups, while blue represents genera with low abundance. (Right) Heatmap depicting differentially abundant genera of any two group of five treated groups. FDR values indicated by asterisks on the color lump of Figure (***FDR < 0.001, **FDR < 0.01, *FDR < 0.05).
