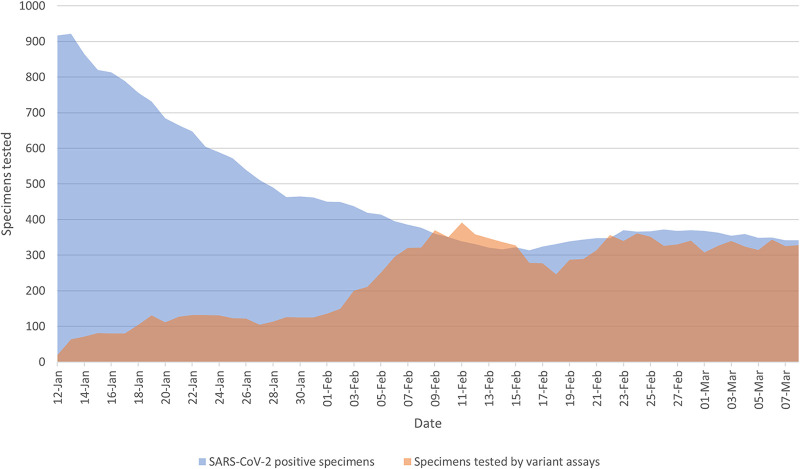
FIG 1.
Rolling 7-day average of SARS-CoV-2-positive specimens tested in early 2021 using the VOC assays. The previous 7-day rolling average of SARS-CoV-2 positive specimens is represented in blue and the same day’s previous 7-day rolling average of the number of specimens tested with both the ΔH69/V70 and N501Y assays is represented in orange.

