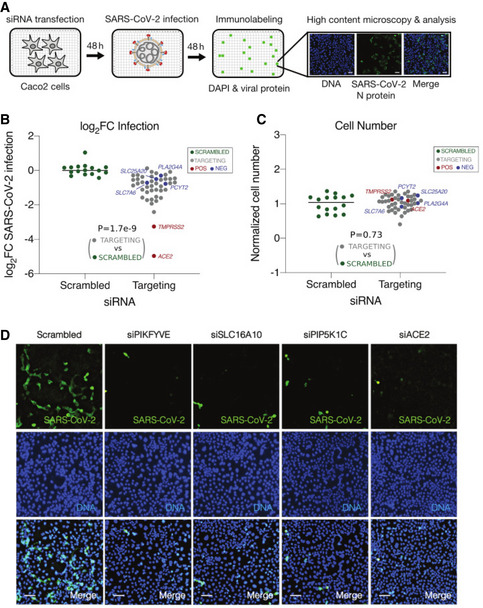
A schematic illustration of the siRNA assay in Caco‐2 cells infected with SARS‐CoV‐2 to validate the antiviral efficacies of the consensus predicted metabolic targets. Caco‐2 cells were transfected with siRNAs for 48 h prior to infection with SARS‐CoV‐2 (MOI = 0.1). Four replicates were performed for each target. At 48 h post‐infection, cells were subjected to staining with SARS‐CoV‐2 nucleoprotein (N) antibody and DAPI, and then imaged to determine the percentage of infected cells after each target knockdown (
Materials and Methods).
Quantification of SARS‐CoV‐2 infection. After the siRNA knockdown of each target, viral infection was quantified as mean log2 fold change (log2FC) of the percentage of SARS‐CoV‐2+ cells relative to the mean of scrambled non‐targeting siRNAs (“SCRAMBLED”, green dots; accordingly, the mean log2FC value of scrambled non‐targeting siRNAs was normalized to zero). Predicted positive targets (“TARGETING”, gray dots), predicted negative targets (“NEG”, blue dots), and positive controls (“POS”, red dots, including ACE2 and TMPRSS2) are all shown. Wilcoxon rank‐sum test P value comparing the predicted positive targets with scrambled non‐targeting siRNAs is given.
Quantification of cell number after each target knockdown, calculated as the mean fraction of DAPI+ cells relative to the scrambled non‐targeting siRNAs (i.e., the latter was normalized to 1). Colors of dots and P value are interpreted in the same way as in (B).
Representative fluorescence images from the siRNA assay showing SARS‐CoV‐2 infection (green channel, top row), cell number (blue channel, middle row), and merged cells (bottom row). Results for scrambled non‐targeting siRNA as negative control (left column), knockdown of three predicted top metabolic targets (PIKFYVE, SLC16A10, and PIP5K1C, middle columns), and knockdown of positive control (ACE2, right column) are shown. Scale bar = 10 μm.

