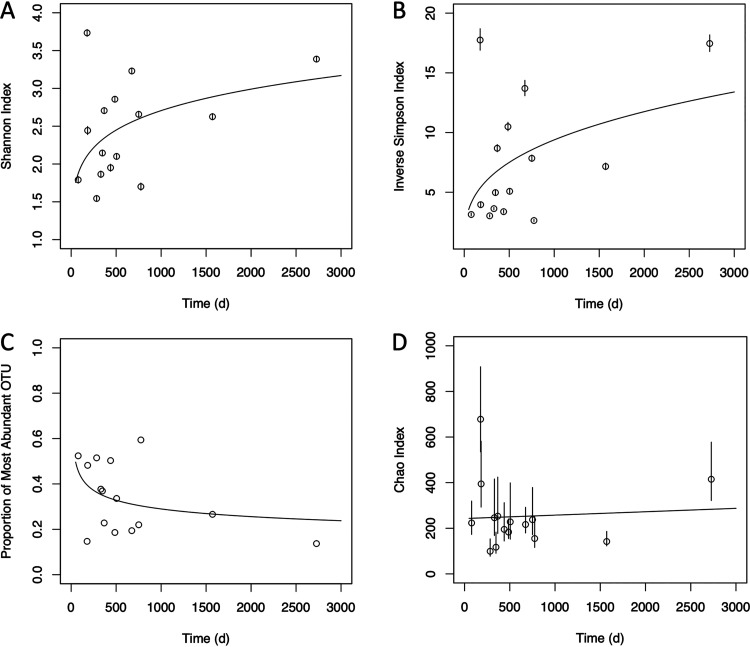
FIG 1.
Changes in culture diversity metrics over time. Points represent parameter estimates, and error bars show the 95% confidence intervals. Fit lines are derived from the best-fit model according to BIC analysis; for panels A to C, the best-fit model was a one-parameter power law, whereas for panel D, the best fit was from a simple linear model. The slope in panel D was not significantly different from zero. Model parameters fitted to data sets omitting the latest time point were not significantly different from those determined with the full data set.

