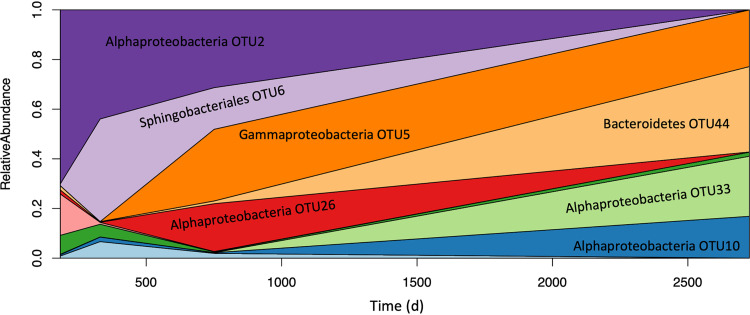
FIG 2.
Bacterial community dynamics in Astrosyne radiata culture 1. The culture was sampled four times over a period of approximately 8 years. Different colors represent different OTUs, with the vertical area covered by each representing its share of the community at a given time point. Note that the leftmost limit of the x axis represents the time of the first sample collection (183 days), not the time of culture isolation (i.e., 0 days).

