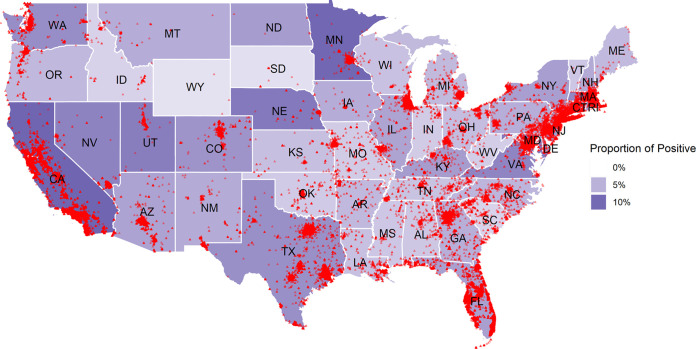
FIG 1.
Map of the continental United States showing the proportions of positive QuantiFERON (1-tube, 4-tube QFT-Plus, and QFT-GIT) results based on the number of tests performed. The darker shade intensity indicates a higher proportion for a state. Individual data points represent a QuantiFERON-TB positive patient.

