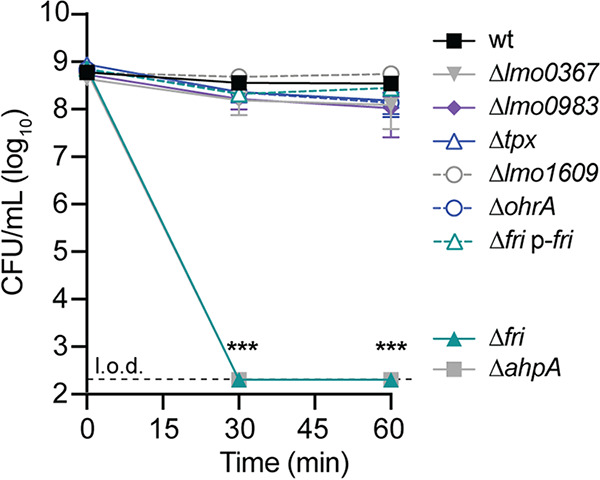
FIG 4.

Acute peroxide toxicity. Bacteria were grown aerobically to mid-log phase before hydrogen peroxide (120 mM) was added. The dotted line indicates the limit of detection (l.o.d.). Data are means and SEM for four biological replicates. P values were calculated using a heteroscedastic Student's t test comparing each mutant to the wt. ***, P < 0.001.
