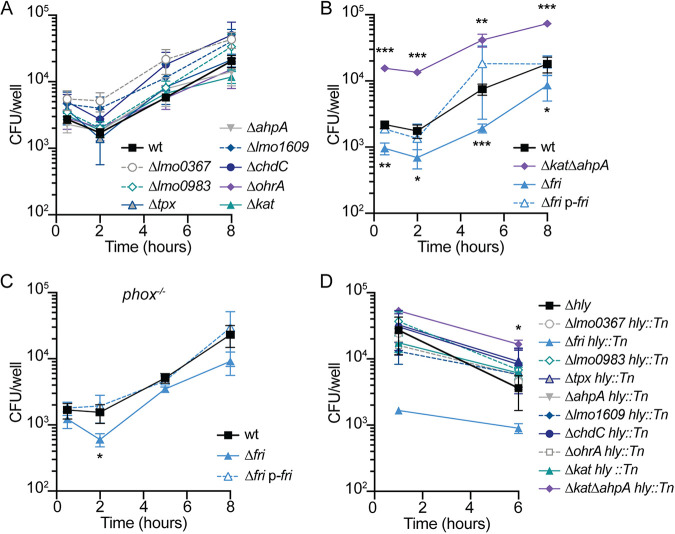
FIG 5.
Intracellular survival and growth of peroxidase mutants in IFN-γ-activated BMDMs. (A) Intracellular growth curves of mutant strains that replicated at the same rate as the wt (P > 0.05 at each time point). (B) Intracellular growth curves in activated BMDMs. (C) Intracellular growth curves in activated phox−/− BMDMs, which lack NADPH oxidase. (D) Survival of hly mutants trapped in the vacuoles of activated BMDMs. Although the error bars are too small to be visible, the Δfri hly::Tn strain is not significantly different from the wt at 1 h (P = 0.06). In all panels, data are means and SEM from at least three independent experiments. P values were calculated using a heteroscedastic Student's t test comparing each mutant to the wt grown under the same conditions. *, P < 0.05; **, P < 0.01; ***, P < 0.001.

