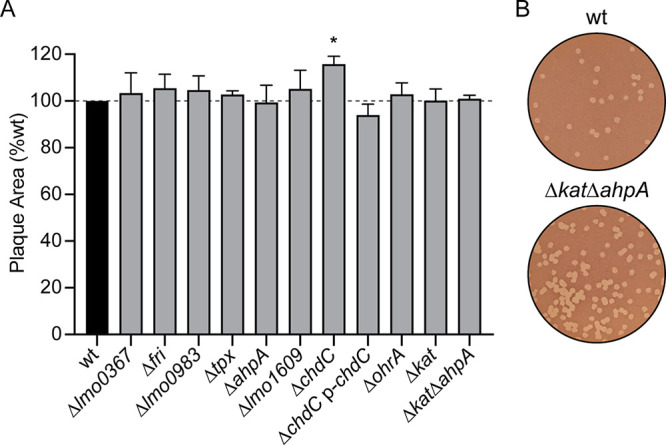
FIG 6.

Intercellular spread of peroxidase mutants. (A) Plaque formation in L2 fibroblasts was evaluated for each strain. Data are means and SEM. The dashed line signifies the 100% level of the wt. (B) Representative images of plaques demonstrating the greater number of plaques formed by the Δkat ΔahpA mutant than the wt.
