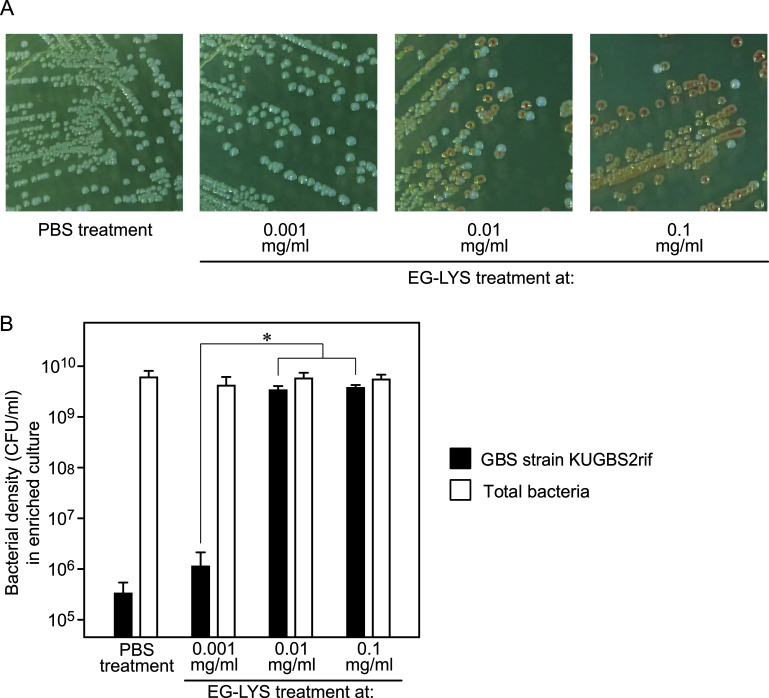
FIG 3.
Effect of EG-LYS treatment in the false-negative model using GBS KUGBS2rif and E. faecalis KUEF29. (A) Appearance of bacterial colonies on Granada agar. On Granada agar, orange colonies are KUGBS2rif, while white colonies are KUEF29. Only E. faecalis appeared on the agar subcultured from the enriched culture with EG-LYS treatment at 0.001 mg/ml and with PBS treatment. Both KUGBS2rif and KUEF29 appeared on the Granada agar subcultured from the enriched cultures with EG-LYS treatments at 0.1 and 0.01 mg/ml. (B) Bacterial densities of KUGBS2rif and total bacteria in enrichment cultures with PBS and EG-LYS treatments. The false-negative model was treated with EG-LYS at 0.1, 0.01, and 0.001 mg/ml. As a negative control, the enriched culture with PBS treatment was used. The means and SD of bacterial densities are presented as column charts with error bars (n = 6). According to one-way ANOVA, no statistical difference was observed among the tested groups in the total bacteria (P > 0.05), while it was observed in the KUGBS2rif strain (P < 0.0001). According to the following Tukey’s post hoc test, the GBS densities increased with statistical significance, as the EG-LYS treatment increased from 0.001 mg/ml to 0.01 and 0.1 mg/ml. Statistical significance is denoted by an asterisk (*, P < 0.001).

