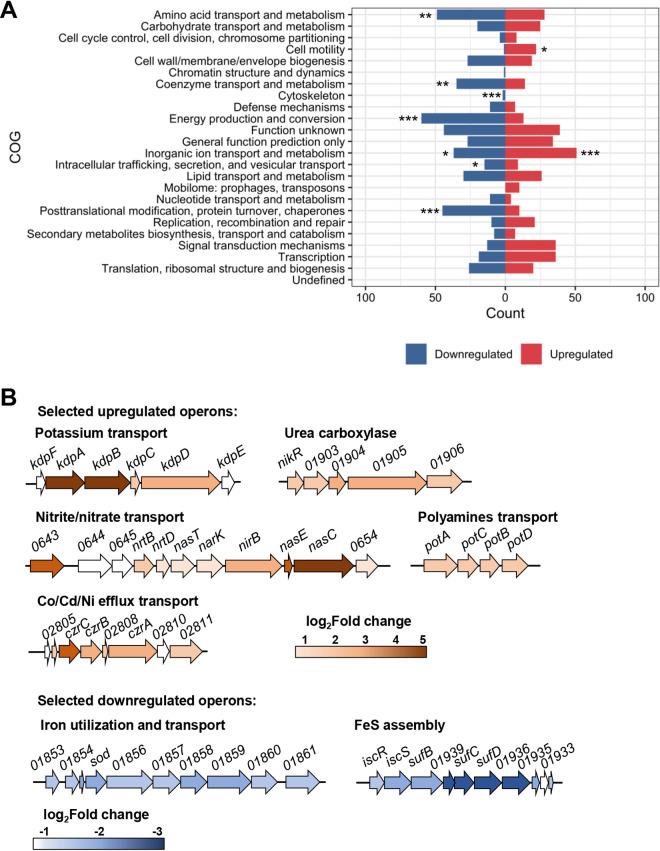
FIG 2.
Functional characterization of the DEG. (A) Enrichment of functional categories among DEG. The total number of genes belonging to distinct orthologous groups of encoded proteins (COG) was analyzed to verify whether the representation of each COG within the up- or downregulated groups was significant against the total gene background. The categories defined as being prominent in each group are those with an adjusted P value of <0.05, as indicated: *adjusted P value < 0.05; **adjusted P value < 0.01; ***adjusted P value < 0.001. (B) Graphic representation of selected up- and downregulated operons. Most of the operons encode transport systems. The levels of expression are color-coded approximately to the log2 fold change of each gene.

