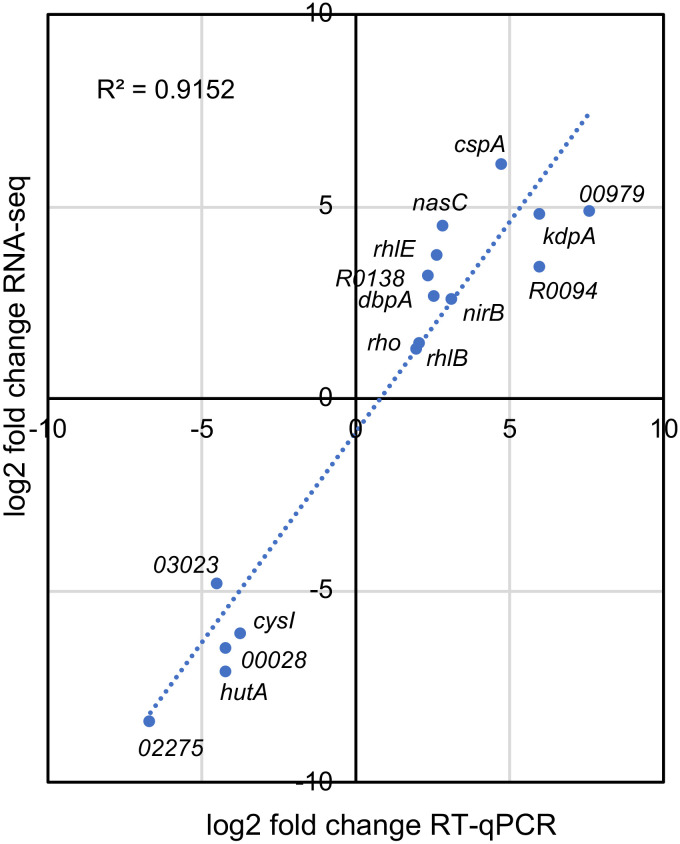
FIG 3.
Validation of RNA-Seq data by RT-qPCR analysis. The relative expression was determined by RT-qPCR from the total RNA of cells incubated at 10°C for 2 h, relative to each gene expression at 30°C. The log2 fold change in the RT-qPCR data was plotted against the log2 fold change obtained from the RNA-Seq data. The expression levels for selected genes were plotted, and the identification of each gene is indicated.

