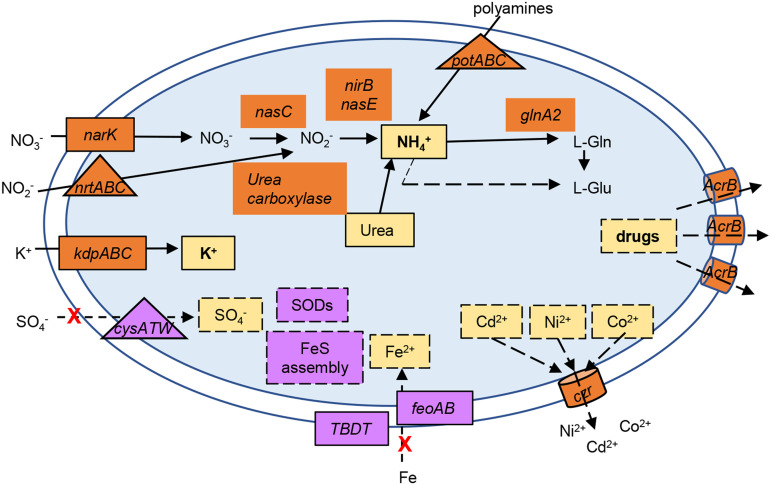
FIG 8.
Overview of the putative alterations in ion homeostasis upon cold stress. The ion transport systems or converting enzymes whose expression was upregulated (in orange) or downregulated (in purple) at 10°C compared to 30°C are indicated. The solid lines indicate a putative increase in the intracellular concentration, while the dashed lines indicate a putative decrease in the intracellular concentration of a given ion or molecule. The red X indicates a decrease of transport; the triangles indicate ABC-type transport systems, and the cylinders indicate RND efflux systems. Probably as a consequence of a lower intracellular concentration of Fe2+ and S, the genes encoding superoxide dismutases (SODs) and FeS assembly were also downregulated. Please refer to Fig. 2B for details of the genes involved.

