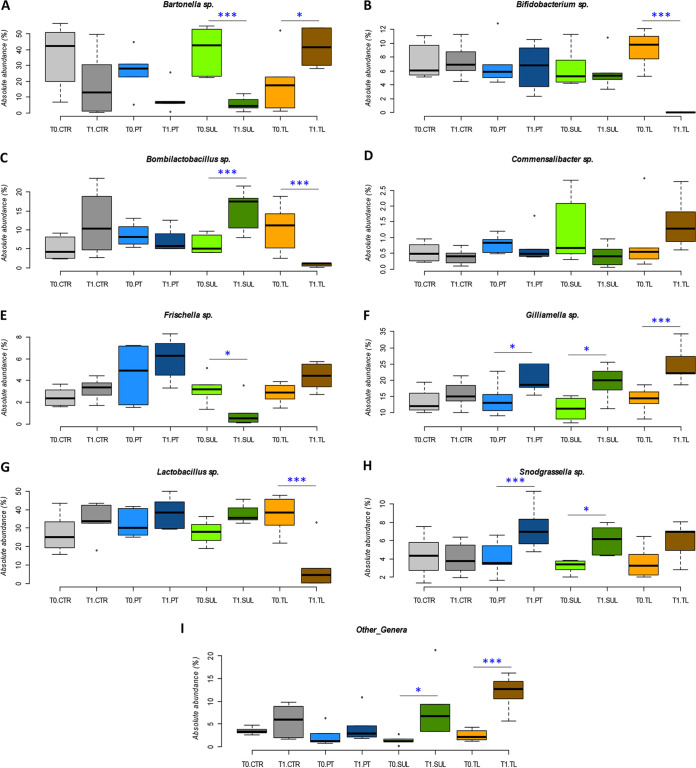
FIG 3.
NGS absolute abundance at genus level. (A to F) Box plots reporting the major microbial genera expressed for their absolute abundance (qPCR-normalized NGS relative abundance) in percentage and in relation to experimental conditions (significant pairwise comparisons: *, P < 0.05; ***, P < 0.01). Boxplots report minimum and maximum values, lower and upper quartile, and median. (A) Bartonella spp. (B) Bifidobacterium spp. (C) Bombilactobacillus spp. (D) Commensalibacter spp. (E) Frischella spp. (F) Gilliamella spp. (G) Lactobacillus spp. (H) Snodgrassella spp. (I) Other_genera, for the experimental conditions. CTR, no antibiotics control; PT, oxytetracycline; SUL, sulfonamides; TL, tylosin.

