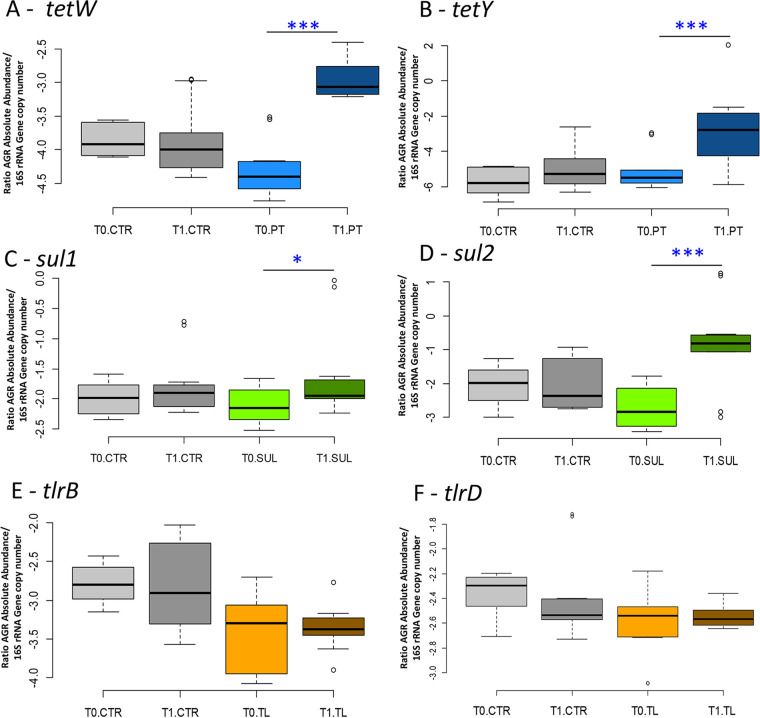
FIG 5.
Antibiotic resistance genes. (A and B) Box plots reporting the ARGs for tetW (A) and tetY (B) for tetracycline resistance genes. (C and D) Box plots reporting the ARGs for sul1 (C) and sul2 (D) sulfonamides resistance genes. (E and F) Box plots reporting the ARGs for tlrB (E) and tlrD (F) tylosin resistance genes. The absolute ARG quantification is normalized with the total 16S rRNA gene copies in relation to experimental conditions (significant pairwise comparisons: *, P < 0.05; ***, P < 0.01).

