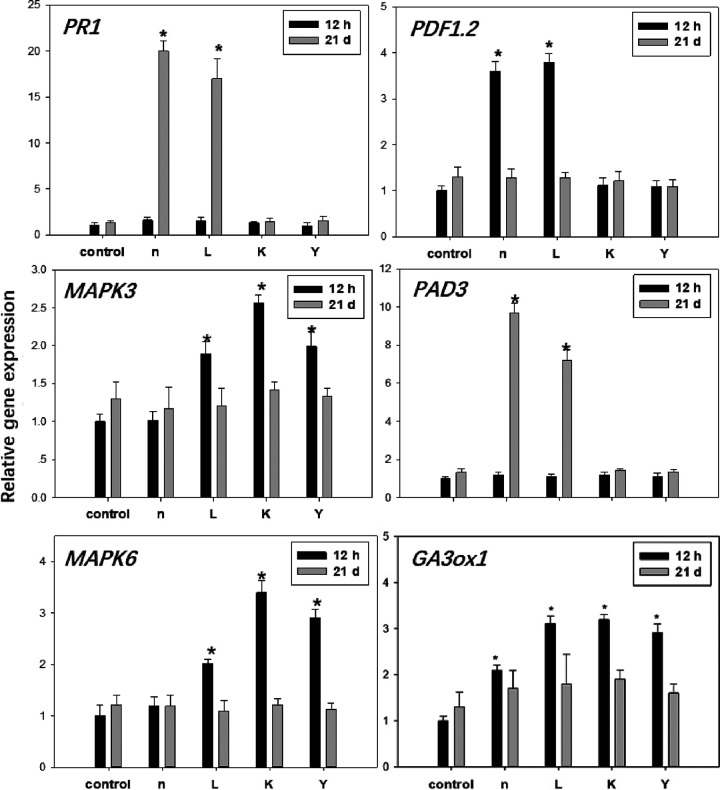
FIG 4.
Quantitative measurements of the gene expression levels (fold differences) in Arabidopsis rosettes under normal growth conditions after bacterial treatment at 21 days and 12 h. Bars within the figure associated with an asterisk (*) represent values statistically different from the control at P < 0.05.

