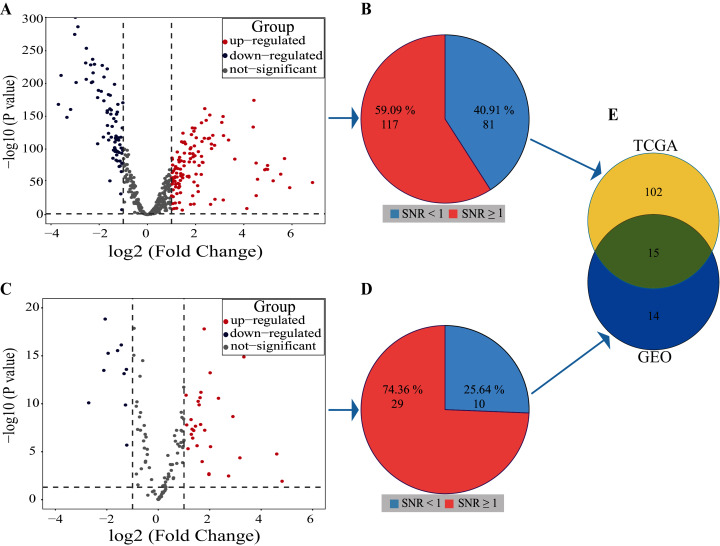
Figure 3. Results of SDE miRNAs.
Volcano (A) and signal-to-noise ratio (B) from TCGA, volcano (C) and signal-to-noise ratio (D) from GEO, A and C, significantly down-regulated and up-regulated miRNAs are painted in blue and red. Venn diagram (E) showed the overlapping results of SDE miRNAs from TCGA and GEO.

