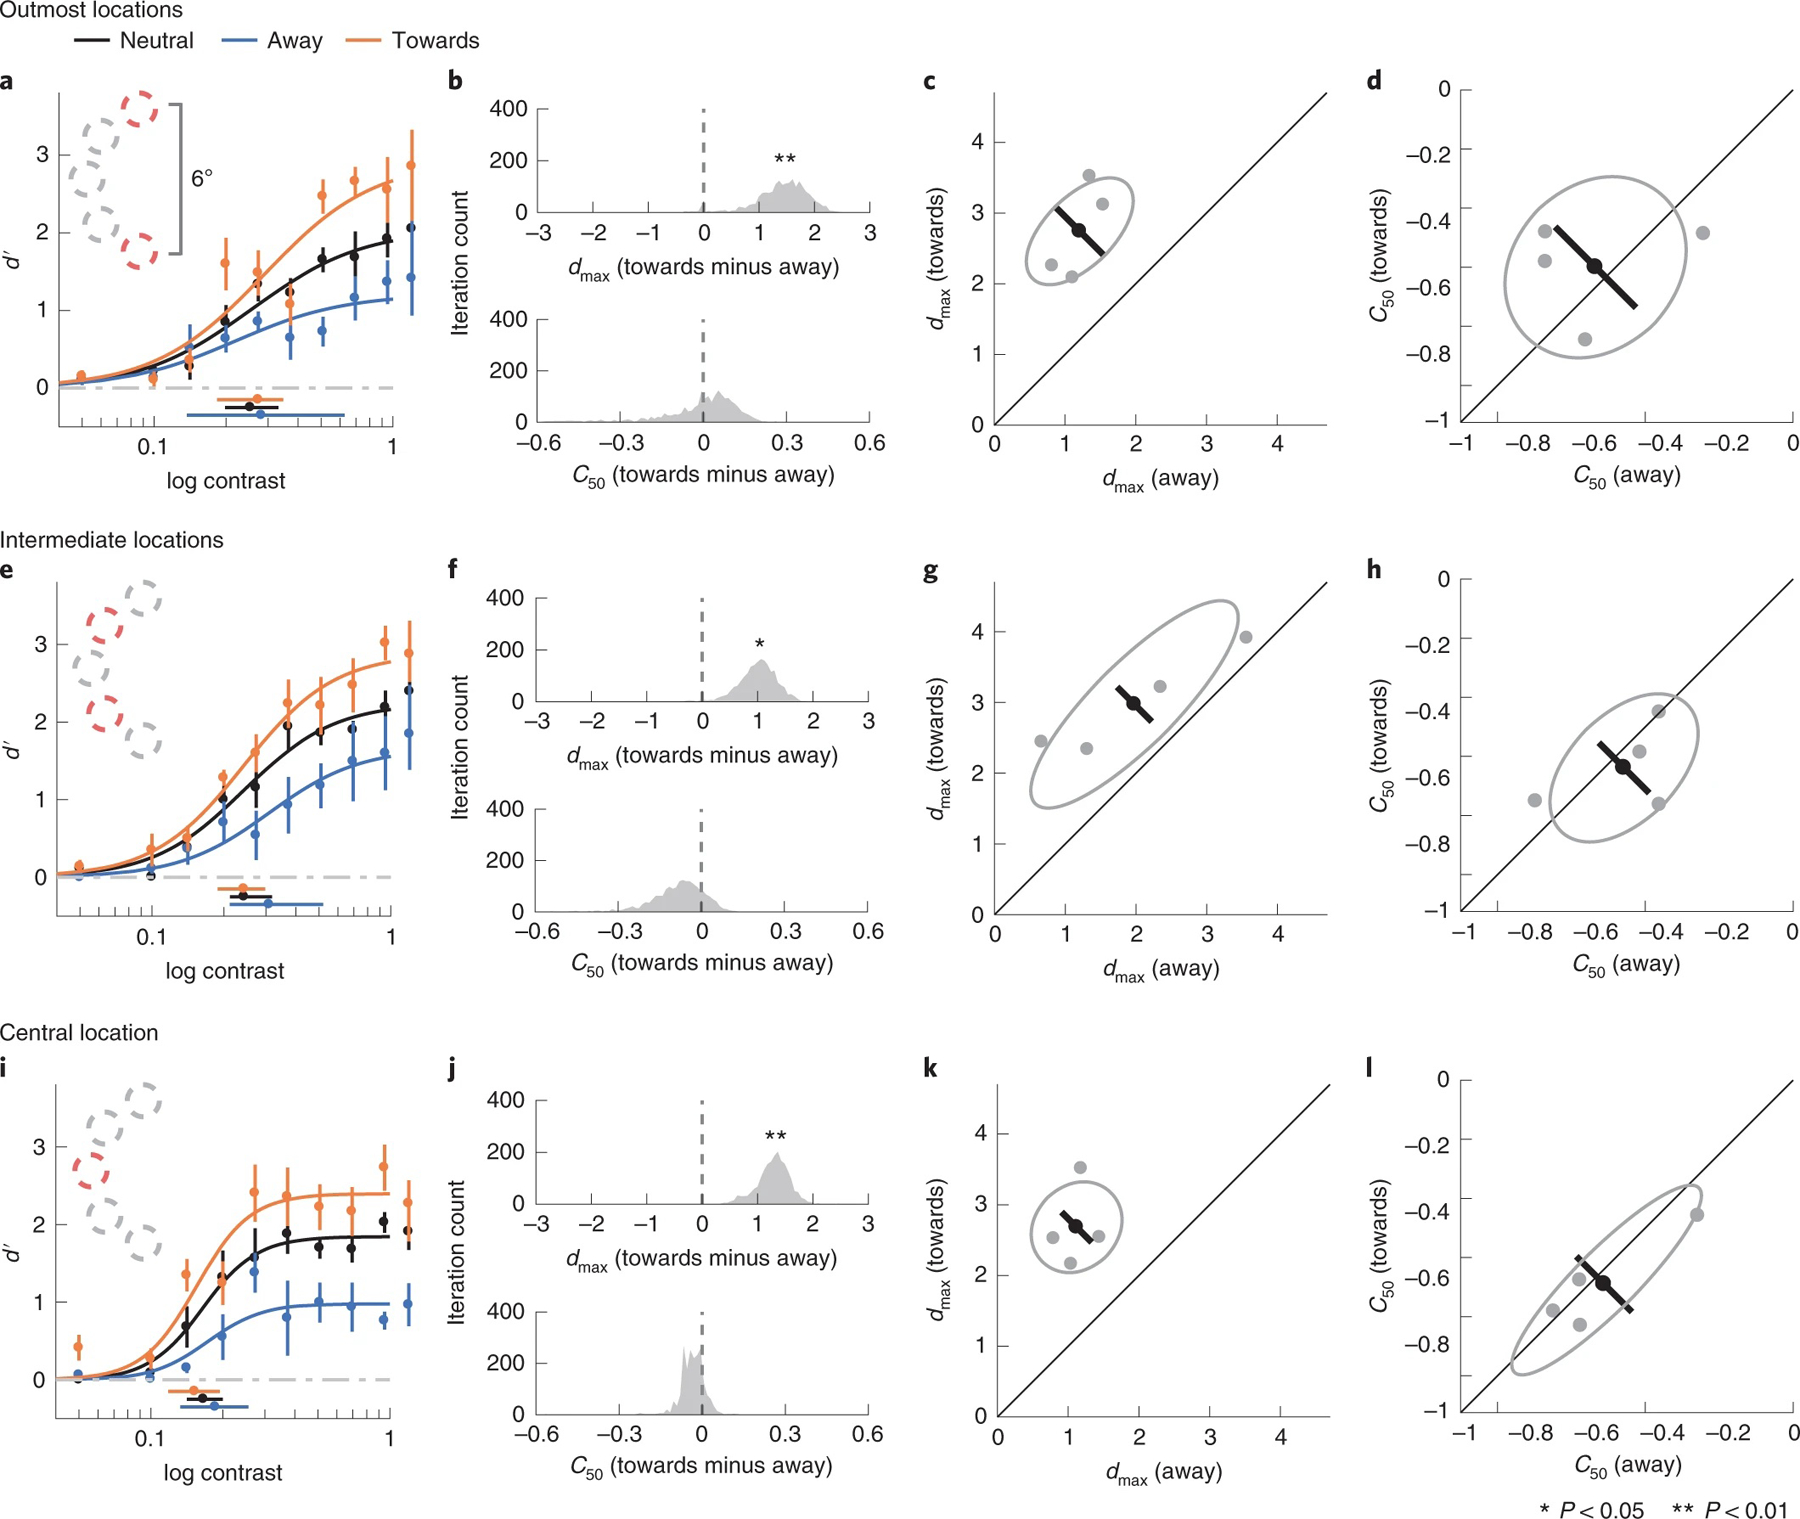
Fig. 6 |. Performance binned by target location in high-uncertainty condition.

a–d, Outmost locations. a, Group-averaged psychometric functions (d′ versus contrast). dmax and C50 of the group-averaged psychometric functions are plotted at the right and the bottom of the figure. The error bars represent 95% bootstrapped confidence interval. b, The bootstrapped distribution of the difference of dmax (top) and the difference of C50 (bottom) between the towards and away conditions. Distributions significantly different from zero are denoted with asterisks. c, Grey dots, best-fitted dmax of individual observers; grey ellipse, the ellipse with major axes oriented towards the difference and the sum of the dmax across two conditions. The difference (or sum) of dmax is first computed for individual observers, and the major axis of the ellipse represents ±1 s.d. of the difference (or sum). The black dot shows the group-averaged dmax and the error bar represents the standard deviation of the bootstrapped distribution of the difference between towards and away conditions. d, C50 illustrated in the same format as in c. e–h, Intermediate locations, corresponding to a–d. i–l, Central location, corresponding to a–d and e–h.
