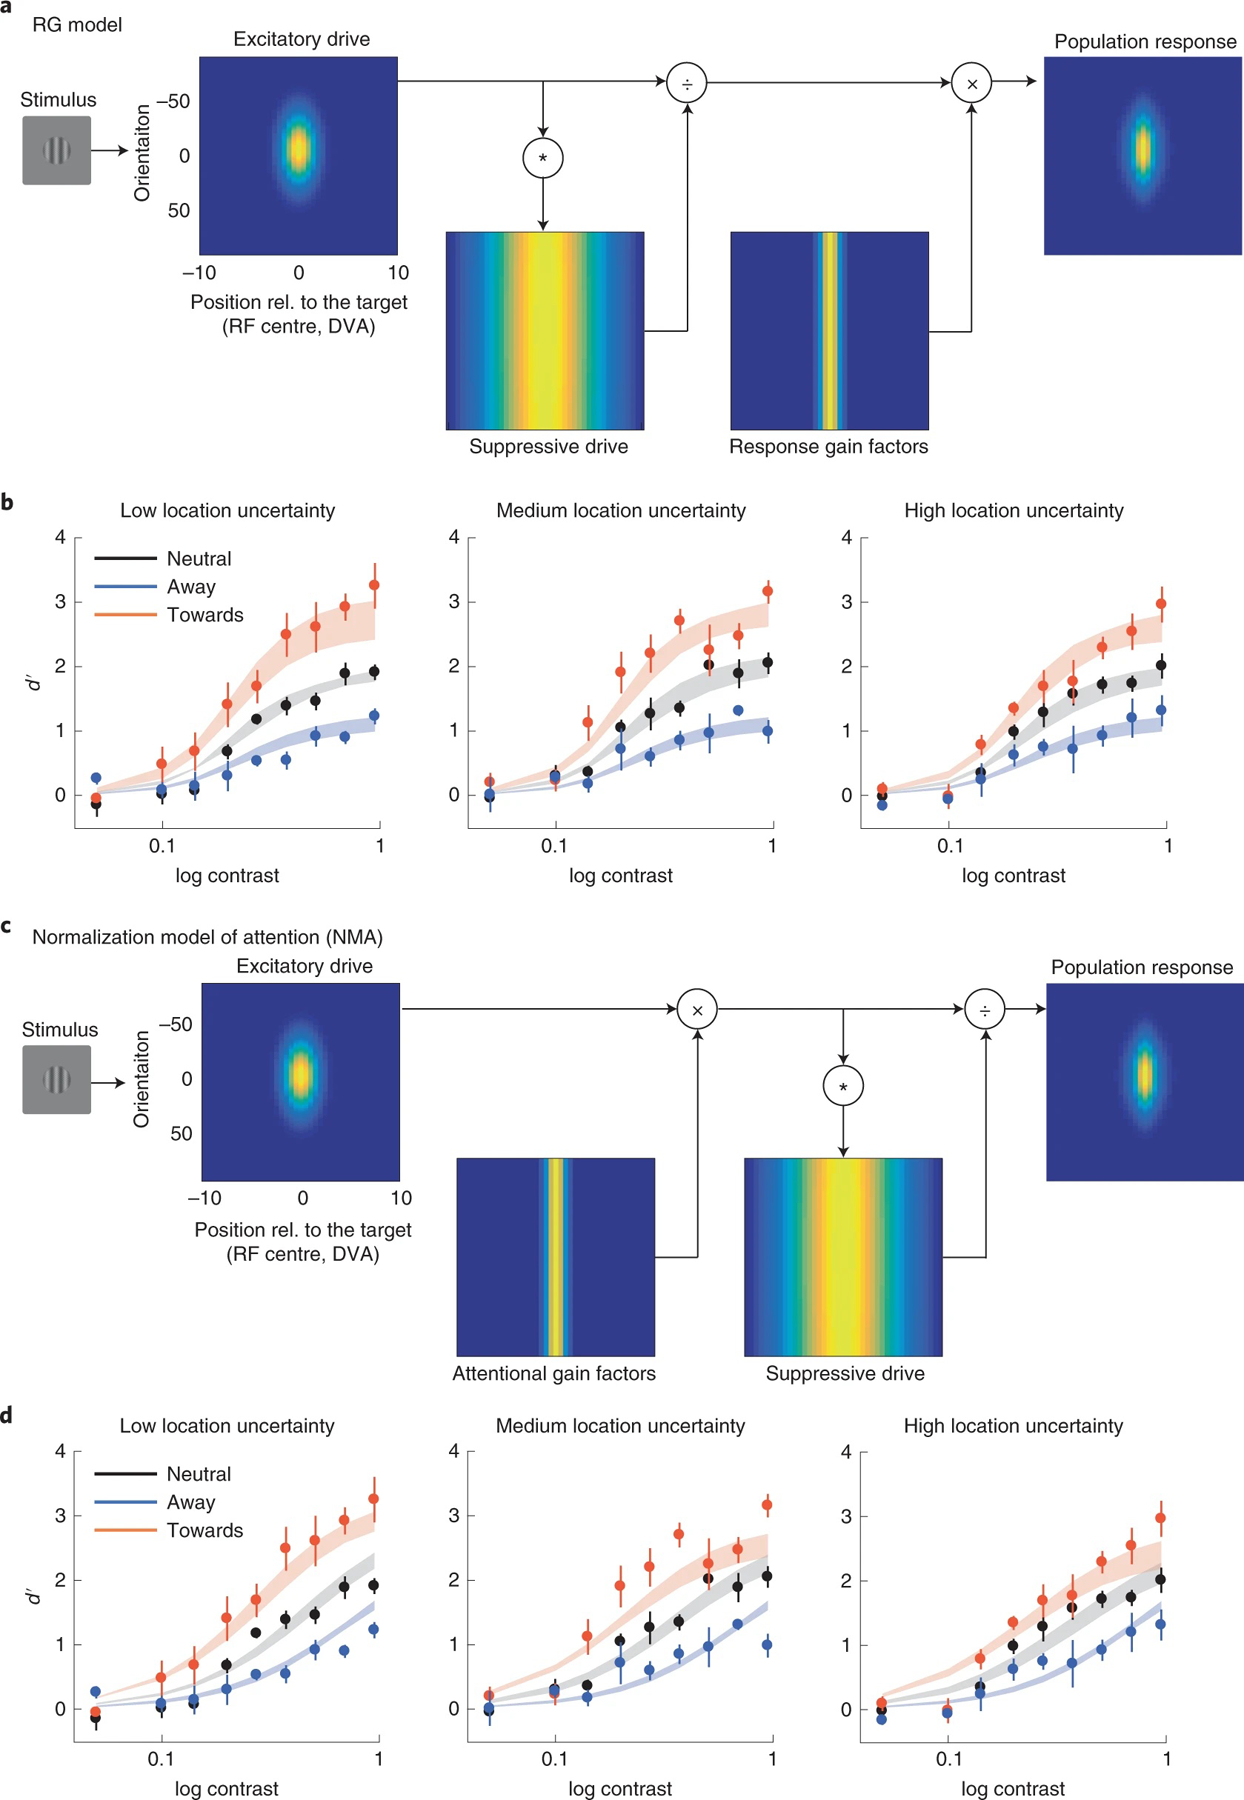
Fig. 7 |. Models and models’ fits.

a, Response gain (RG) model: attention multiplicatively modulates neural response after normalization. Simulated neurons are arranged in each panel according to their receptive field centre (x axis; DVA, degree visual angle) and preferred orientation (y axis, where 0 represents vertical orientation). The excitatory drive is determined by the preferred orientation and location of the simulated neurons. Brightness at each location in the image corresponds to the excitatory drive of a single neuron. The suppressive drive is computed by convolving the excitatory drive with the suppression kernel (Supplementary Fig. 14). That is, the suppressive drive is the excitatory drive pooled over space and orientation. In the response gain model, the neural response is computed by dividing the excitatory drive by the suppressive drive, and then multiplied by the response gain factors. b, Model fit of the response gain model. Data points and error bars represent group-averaged data and ±1 s.e.m. The model was fitted to individual observers, and the shaded areas represent the average of the fits across observers (mean ± 1 s.e.m.). c, Attentional modulation based on Reynolds and Heeger’s NMA. Different from the response gain model, attention is modelled by attentional gain factors that are multiplied with the excitatory drive of the neurons before normalization. d, Model fit of the NMA model. Data points and error bars represent group-averaged data and ±1 s.e.m. The model was fitted to individual observers, and the shaded areas represent the average of the fits across observers (mean ± 1 s.e.m.).
