Figure 6.
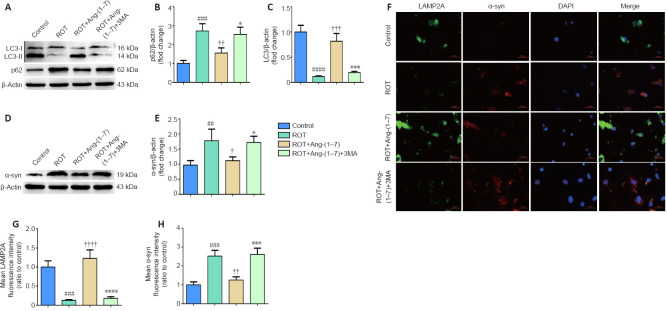
Activation of autophagy contributes to the clearance of α-synuclein accumulation in the rotenone-induced cell model.
(A)The p62 and LC3-II levels were determined by Western blot assay. (B) Quantitative results of p62 expression. (C) Quantitative results of LC3-II expression. (D) The expression of α-syn was detected by Western blot assay. (E) Quantitative results of α-syn expression. (F) The number of LAMP2A-positive cells (green) and α-syn-positive cells (red) by immunofluorescence were observed with a fluorescent microscope (original magnification, 630×). (G) Mean LAMP2A fluorescent intensity (ratio to control) of four groups. (H) Mean α-syn fluorescence intensity (ratio to control) of four groups. Data are expressed as the mean ± SD (B, C, E; n = 3; one-way analysis of variance followed by Tukey's post hoc test). ##P < 0.01, ###P < 0.001, ####P < 0.0001, vs. control group; †P < 0.05, ††P < 0.01, †††P < 0.001, ††††P < 0.0001, vs. ROT group; *P < 0.05, ***P < 0.001, ****P < 0.0001, vs. ROT + Ang-(1–7) group. 3-MA: 3-Methyladenine; Ang-(1–7): angiotensin-(1–7); DAPI: 4′,6-diamidino-2-phenylindole; LAMP2A: lysosomal-associated membrane protein 2A; LC3: microtubule associated protein 1 light chain 3; ROT: rotenone; α-syn: α-synuclein.

