Figure 4.

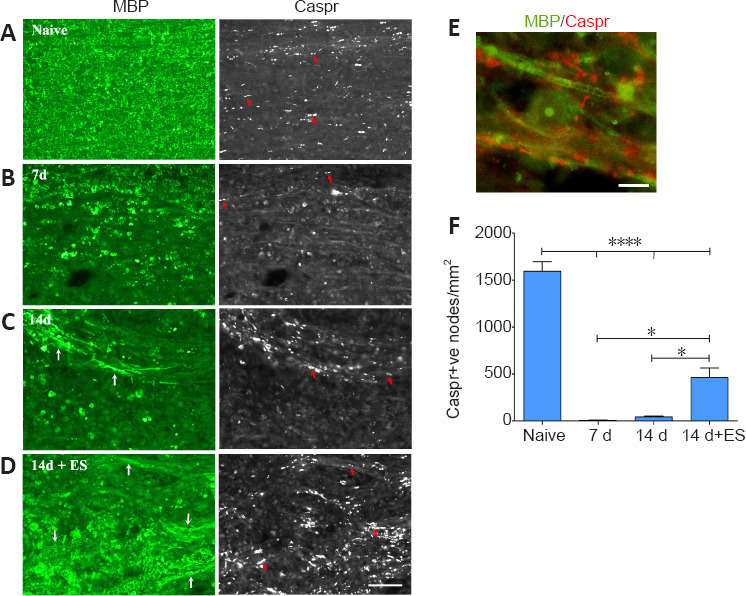
ES promotes reappearance of Caspr-positive paranodal regions in 14 day focally demyelinated dorsal columns.
Longitudinal sections of spinal cord dorsal columns (DC) show a positive correlation between abundant myelin staining (MBP; green) in DC and number of punctate aggregates of paranodal protein Caspr on either side of the node (examples-red arrows). All post-LPC timepoint pictures are taken from FG intense regions coinciding with the focally demyelinated regions. Seven days following focal demyelination (B), myelin is lost with MBP localizing to round cells consistent with macrophage morphology. Caspr-positive paranodes (red arrows) are only detected along the boundaries of the focally demyelinated area. By 14 days post-LPC (14 days; C) a few nodes are detected (examples-red arrows) in regions appearing to undergo remyelination (white arrows). ES (14 days + ES; D) increases the numbers of Caspr-positive paranodes in the demyelinated regions (examples-red arrows) which have increased MBP (white arrows) consistent with enhanced remyelination. (E) High power example of Caspr-positive paranodal regions (red) associated with linear MBP (green) within previously demyelinated zone in 14 days + ES animal. Note the appearance of a MBP-positive circular cell, likely a macrophage/microglia that has phagocytosed myelin. Scale bars: 50 μm for A–D and 10 μm for E. (F) Quantification of the number of Caspr-positive (+ve) paranodes detected/mm2 of focally demyelinated DC regions reveals a significant increase in the density of paranodes detected in response to ES relative to focal demyelination alone. Data are expressed as the mean ± SEM. n = 4 animals analysed/experimental group. *P < 0.05, ****P < 0.0001 (one-way analysis of variance with Bonferroni's post hoc analysis).
