
Figure 4.
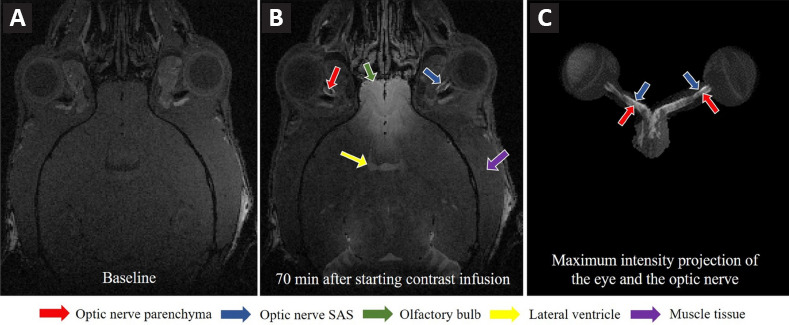
In vivo gadolinium-MRI of the cerebrospinal fluid dynamics in the mouse optic nerve.
3D dynamic contrast-enhanced MRI at the level of the eye and the optic nerve before (A) and at 70 minutes (B) after starting gadolinium contrast infusion into the subarachnoid space of the lumbar spine. Arrows indicate the corresponding brain and muscle regions of interest. Maximum intensity projection after image segmentation of the eyes and the optic nerves in (C). Note the apparent signal enhancement not only in the optic nerve SAS but also the optic nerve parenchyma. Reproduced with permission from Faiq et al. (2020). SAS: Subarachnoid space.