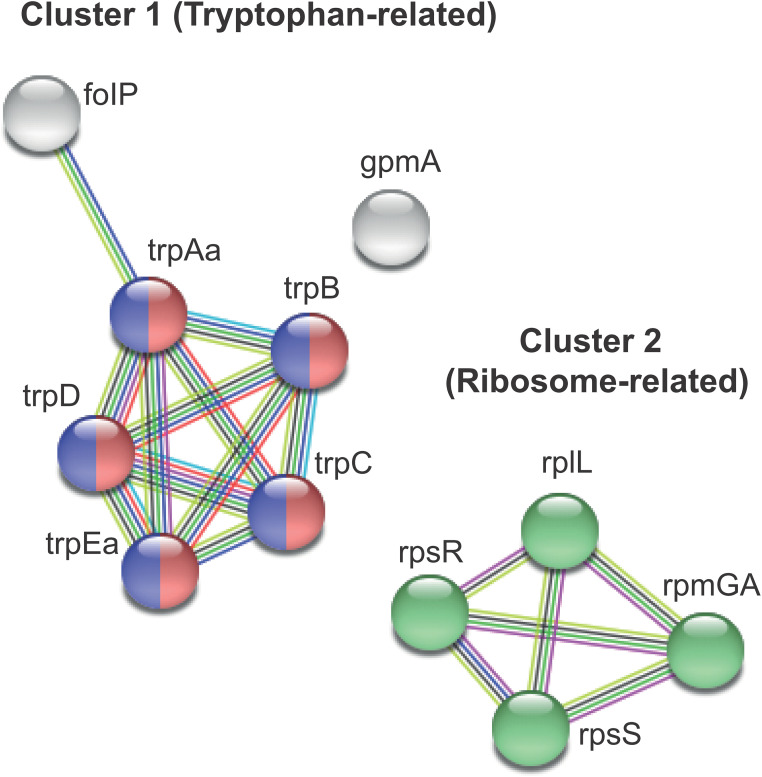
FIG 2.
Network of genes regulated in S. oralis in coaggregation with S. gordonii visualized using the STRING database. Nodes were clustered by Markov cluster (MCL) clustering into three groups, represented by a single gene (gpmA, encoding 2,3-bisphosphoglycerate-dependent phosphoglycerate mutase) and two gene clusters indicated in circles of different colors. Interactions between nodes are depicted by colored solid lines. Different colors represent evidence from different sources, such as gene neighborhood (green), gene cooccurrence (dark blue), text mining (yellow), curated databases (cyan), experimentally determined (magenta), coexpression (black), protein homology (light blue), and gene fusions (red). Genes involved in phenylalanine, tyrosine, and tryptophan biosynthesis (red nodes), biosynthesis of amino acids (blue nodes), and ribosome (green nodes). Following coaggregation, all genes in cluster 1 were downregulated, whereas the genes in cluster 2 were upregulated in S. oralis.

