
FIG 2.
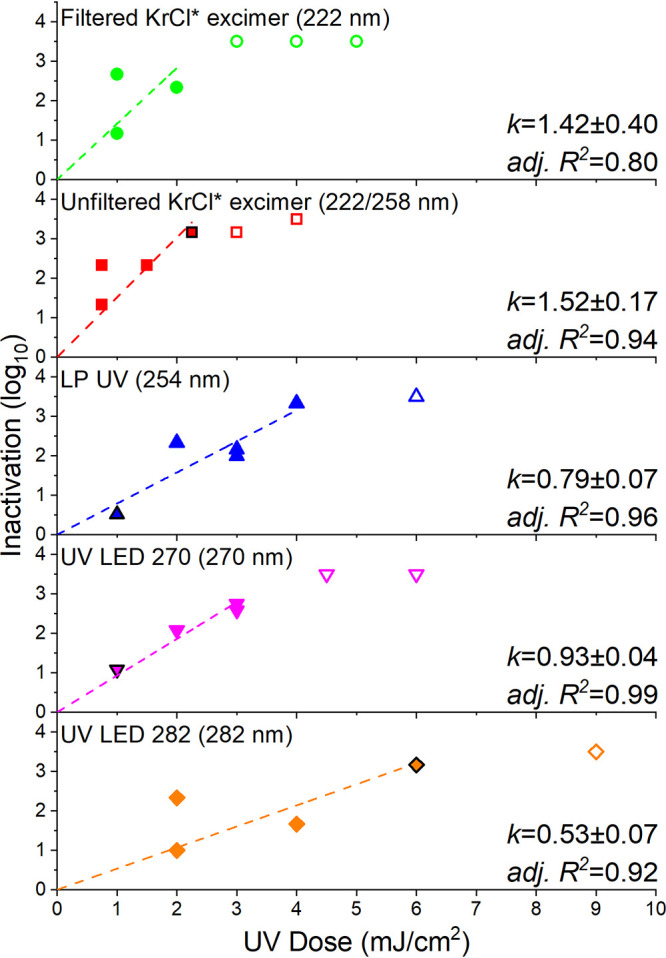
Dose response of SARS-CoV-2 to UV irradiation from all tested UVC devices. Dashed lines represent linear regression results computed from experimental data. The k values (mean ± standard error in cm2/mJ) and adjusted R2 values are listed. Open symbols represent samples with infectivity equal to or less than the detection limits. Solid symbols with a black edge represent two samples overlapping in the plot with the same UV dose response. Primary emission wavelengths for UVC devices are listed in each panel.