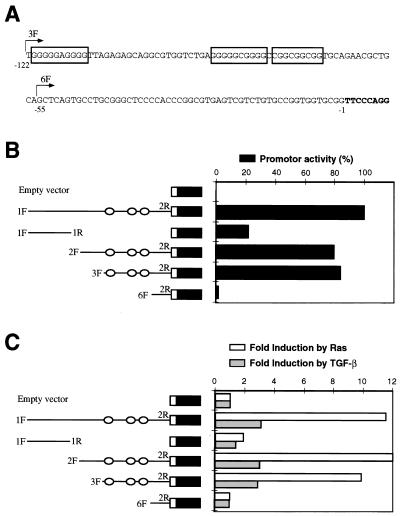
FIG. 6.
Deletion analysis of the mouse p15INK4b promoter. (A) Proximal sequence upstream p15INK4b exon 1. Nucleotide positions are numbered backward from the first base of the cDNA sequence (nucleotides in boldface). Different fragments upstream of the p15INK4b gene were amplified by PCR and subcloned into the luciferase reporter vector. The 5′-end position of some primers used for amplification (3F and 6F) is shown by arrows. Primer 2R (not shown) is a reverse oligonucleotide inside the cDNA sequence. Boxes indicate putative recognition sites for the Sp1 family of transcription factors. (B) Scheme of the deletion fragments and promoter activity (black bars). Circles indicate the positions of putative Sp1-binding sites. The data shown are as percentages of the activity of p15-1F2R-luc (100%) carrying a 720-bp insert. (C) Induction of promoter activity by Ras and TGF-β. The constructs were cotransfected with an activated Ras plasmid (pMZNT-17) or the vector pcDNA3.1. Fold induction by oncogenic Ras (white bars) was compared to the luciferase activity of the same fragment cotransfected with the empty vector. Fold induction by TGF-β (gray bars) corresponded to the increase in luciferase activity after TGF-β treatment of HaCaT cells transfected with the constructs. All of the data shown here were normalized to β-galactosidase activity as described in Materials and Methods and are representative of three separate experiments.

