-
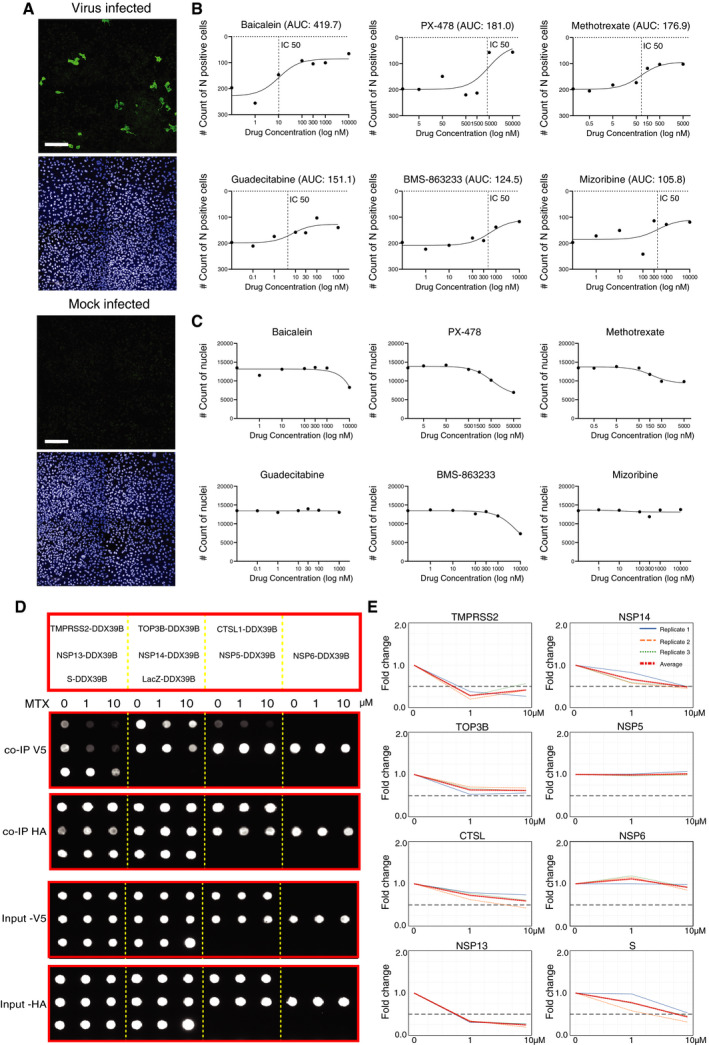
A
For the image‐based drug screening, Calu‐1 cells were infected with SARS‐CoV‐2 in the presence of drugs with indicated doses for 48 h, immunostained, imaged, and analyzed. The example images of mock‐infected cells and virus‐infected control cells (no drugs). The viral yield in cells was detected with an antibody for the viral N protein (virus‐infected cells; upper image), and nuclear staining (mock‐infected cells; lower image) (Scale bar: 200 μm).
-
B
The dose–response curves for six drugs with potential antiviral effects. The drug‐induced inhibition of virus infection (count of N protein‐positive cells) was quantified using the area under the curve (AUC) values.
-
C
The effect of drugs on cell viability in the presence of the virus, e.g., cytotoxicity, was evaluated by the count of nuclei.
-
D
Inhibition of interactions formed with DDX39B in the presence of MTX using the Co‐IP assay. DDX39B is fused to the C‐terminus of a V5 tag, and the interaction partner is fused with a Strep‐HA tag. The diagram (upper) shows the interaction pairs formed with DDX39B used for Co‐IP assay. Dot‐blot results (lower) show the interaction pairs (arrangement as upper panel) in the presence of different concentrations of MTX as indicated on the top of the image. The image displayed is representative of three replicates (n = 3).
-
E
Quantification of DDX39B binding to different interaction partners. Quantification of V5‐tagged DDX39B protein amount was normalized over HA‐tagged interaction partner intensity and displayed as a fold change over the ratio of untreated cells. Data that represent the mean of three replicates are highlighted in red. A fold change > 0.5 is considered significant.