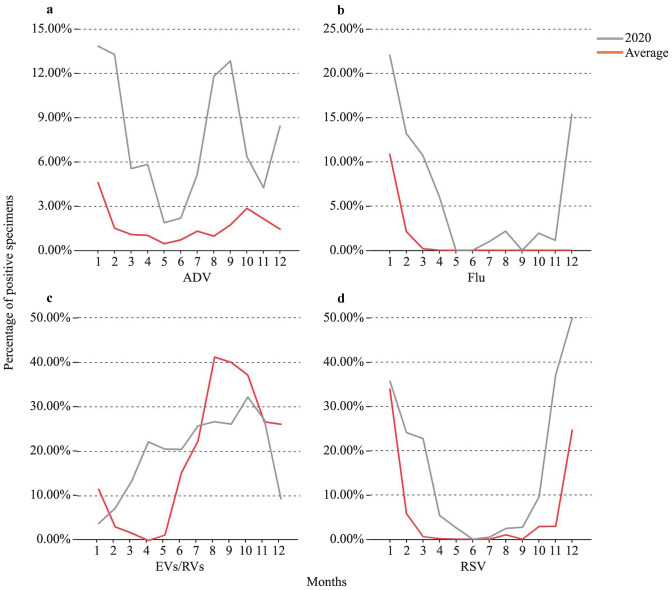
Fig. 1.
Comparison of monthly distribution of several respiratory viruses (not all included) screened in the study based on the percentage of positive specimens in 2020 and the average during Jan 2017–Dec 2019. a The percentage of adenovirus (ADV)-positive specimens relative to the number of tests in 2020 (red curve) compared with the average value in 2017–2019 (grey curve); b the percentage of influenza (Flu)-positive specimens relative to the number of tests in 2020 (red curve) compared with the average value in 2017–2019 (grey curve); c the percentage of enterovirus (EV)/rhinoviruses (RV)-positive specimens relative to the number of tests in 2020 (red curve) compared with the average value in 2017–2019 (grey curve); d the percentage of respiratory syncytial virus (RSV)-positive specimens relative to the number of tests in 2020 (red curve) compared with the average value in 2017–2019 (grey curve)

