
Figure 2.
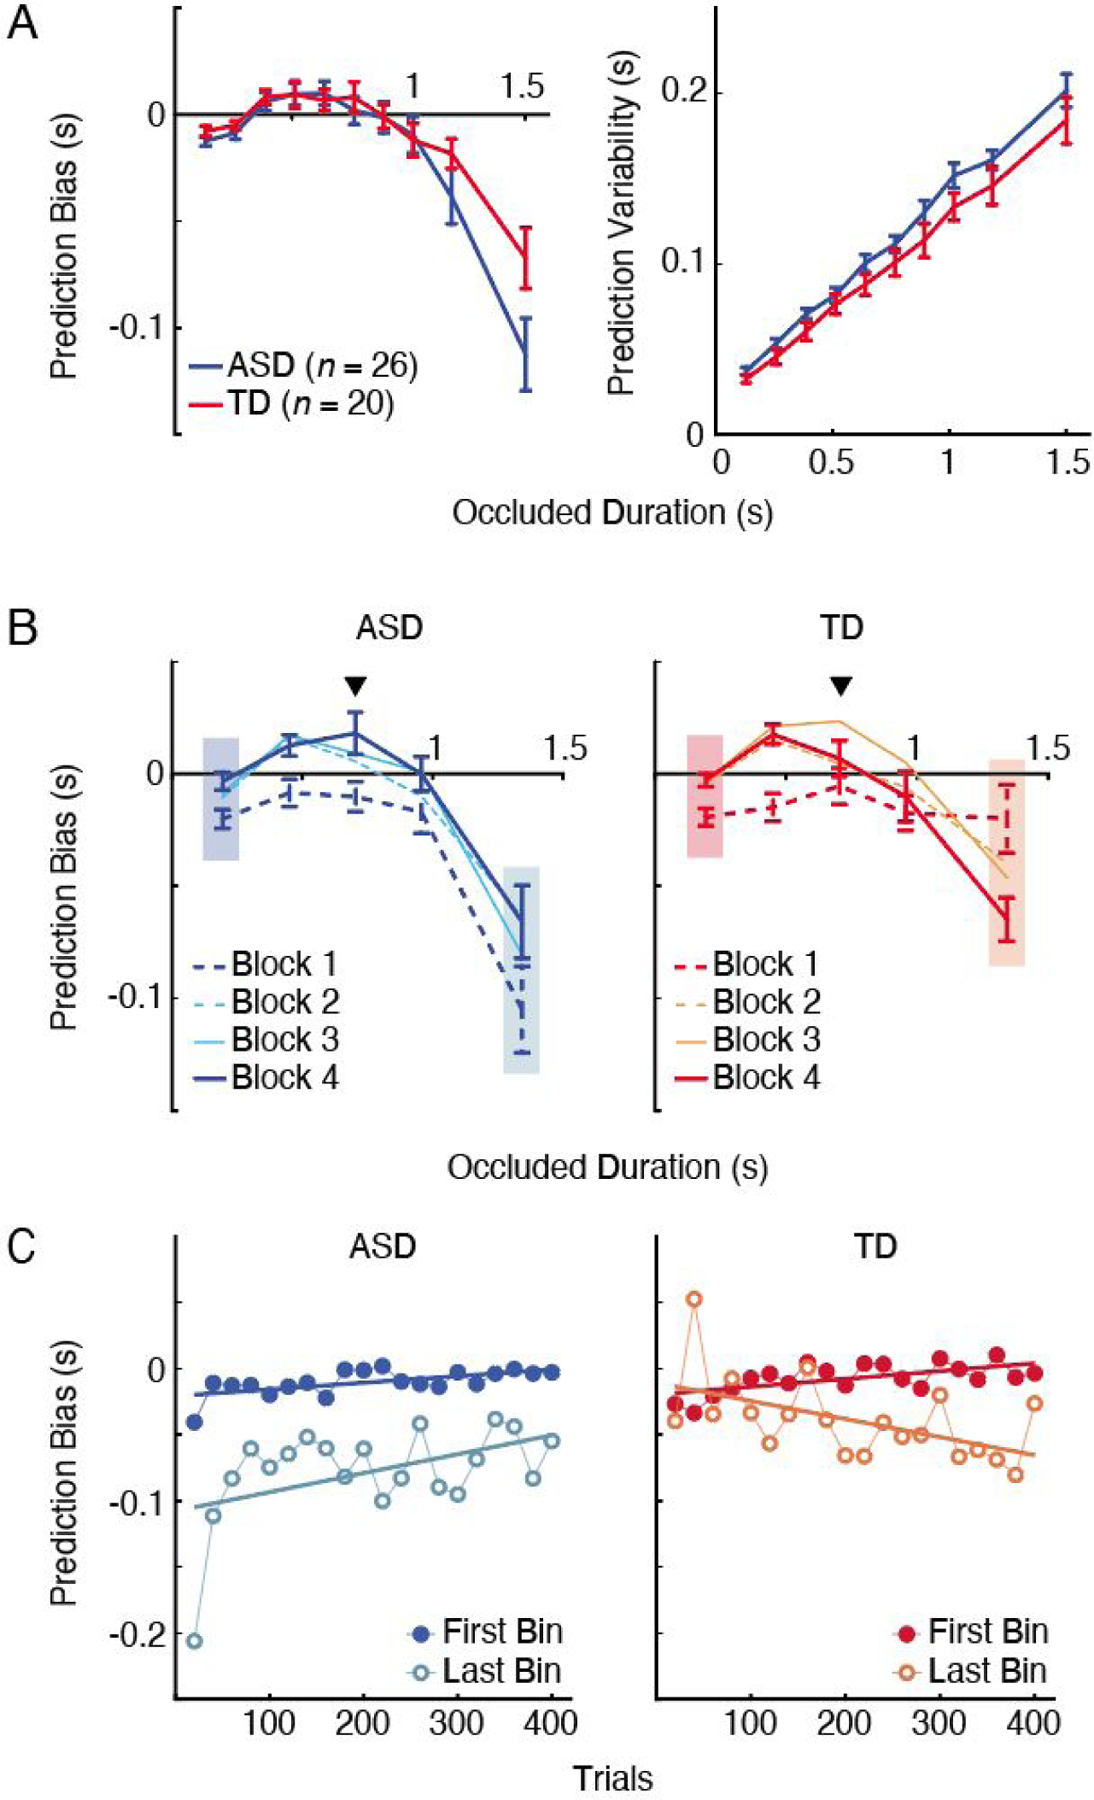
Prediction performance across varying occluded durations for ASD (blue) and TD (red). A: Group average for prediction bias (left) and variability (right) across all trials (0 indicates accurate prediction). Error bars are the standard error of the mean. B: Average prediction bias in each block across occluded durations for ASD (left) and TD (right). Inverted triangles show the mean occluded duration for the stimuli used in the study. Error bars are the standard error of the mean. The shaded rectangles indicate the bins used for the analyses in Panel C. C: The development of prediction bias (averaged every 20 trials) over time in ASD (left) and TD (right) at the first (darker colors) and last (lighter colors) bins of the occluded durations. Data for each bin is fit with a standard linear regression.