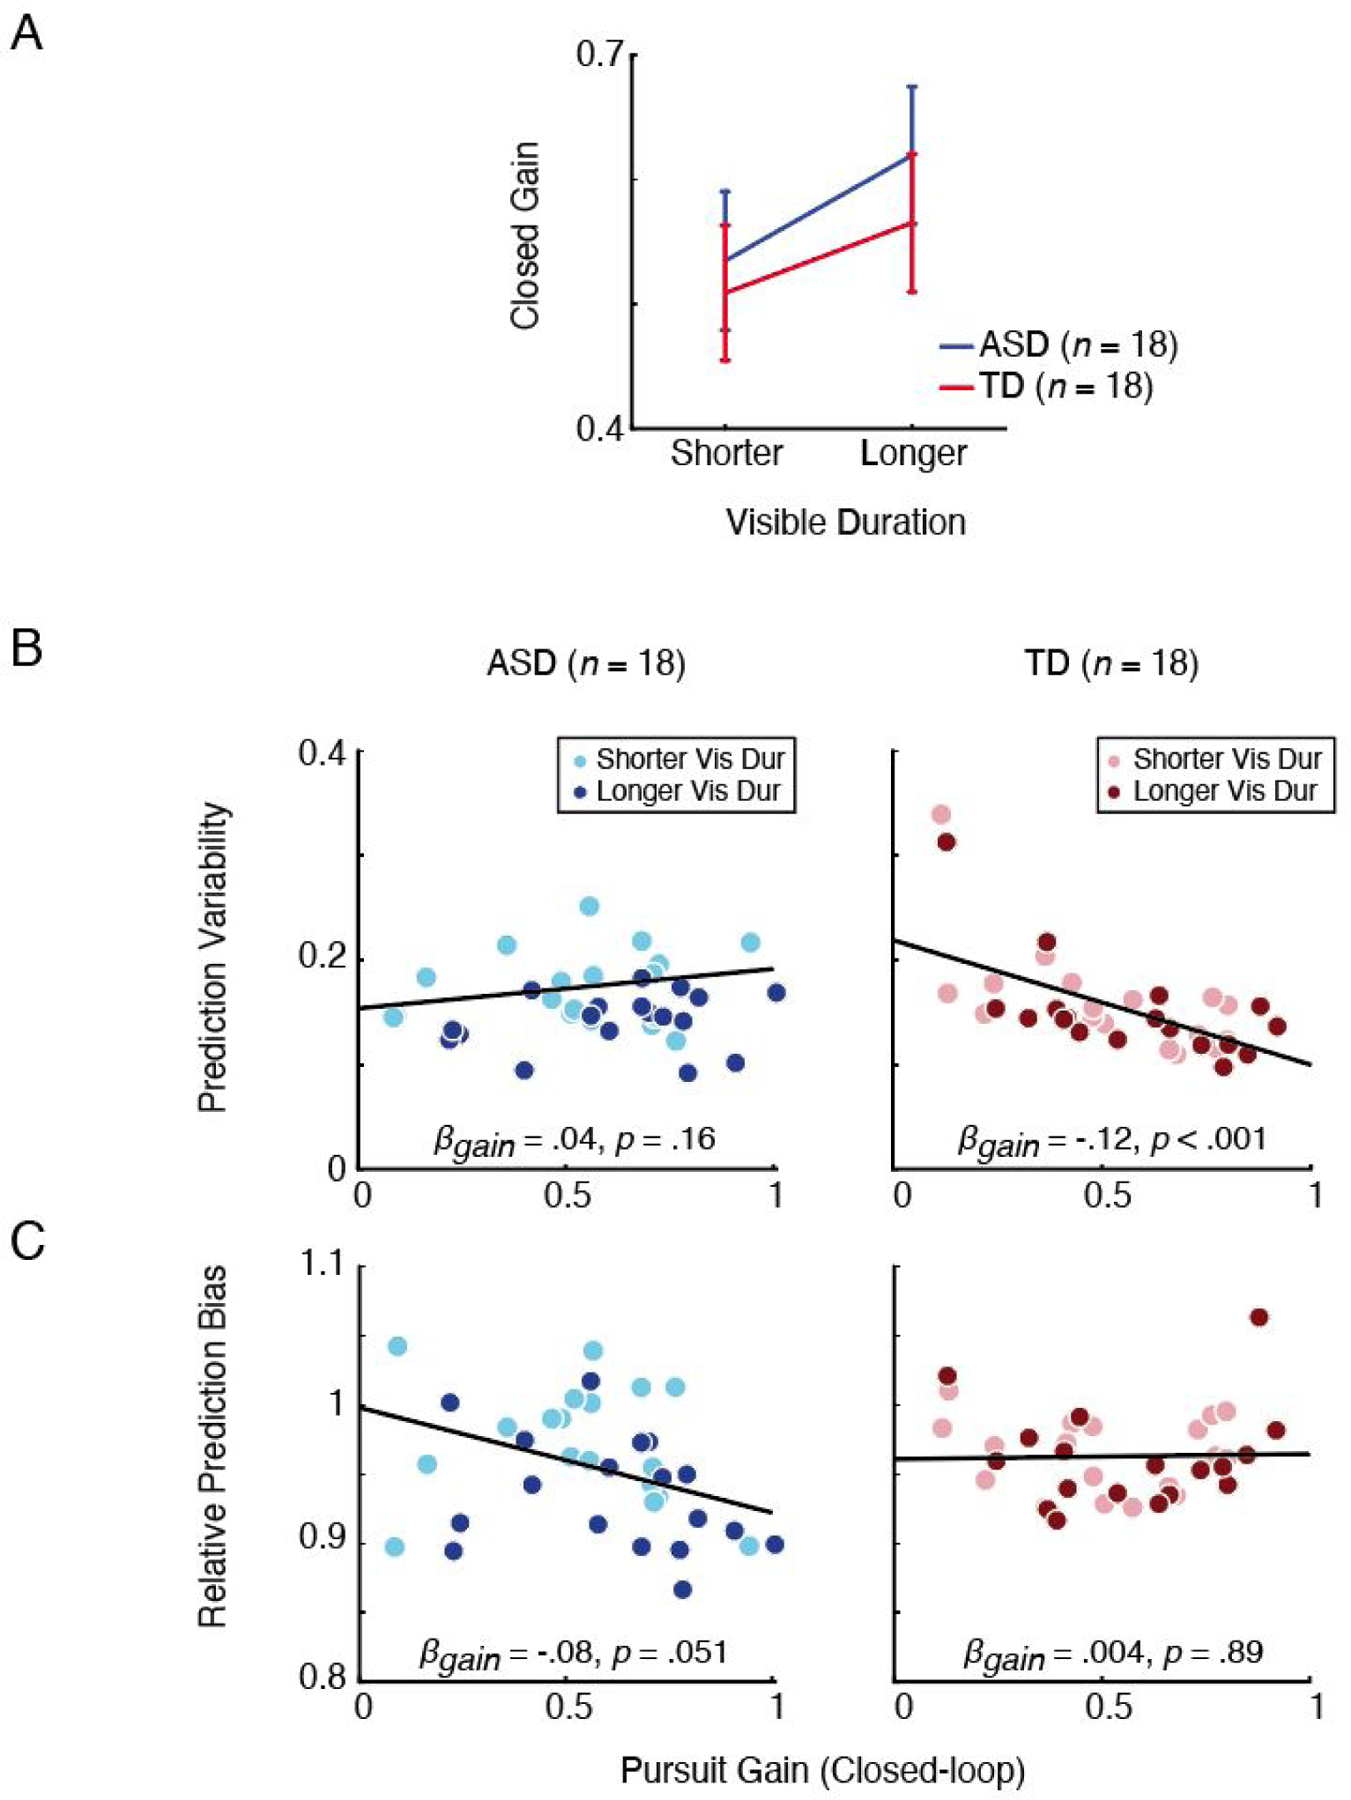
Figure 4.

A: The effect of visible duration on closed-loop pursuit gain. Blue and red curves indicate ASD and TD, respectively. Error bars are standard error of the mean. B: Relationship between closed-loop pursuit gain and prediction variability for ASD (left) and TD (right). Each colored dot represents the mean from an individual participant’s data for either shorter (lighter colors) or longer (darker colors) visible durations. Black lines are the fit from linear mixed effects model analyses. C: Relationship between closed-loop pursuit gain and relative prediction bias (< 1 indicates early bias) for ASD (left) and TD (right). Color schemes are identical as in B.
