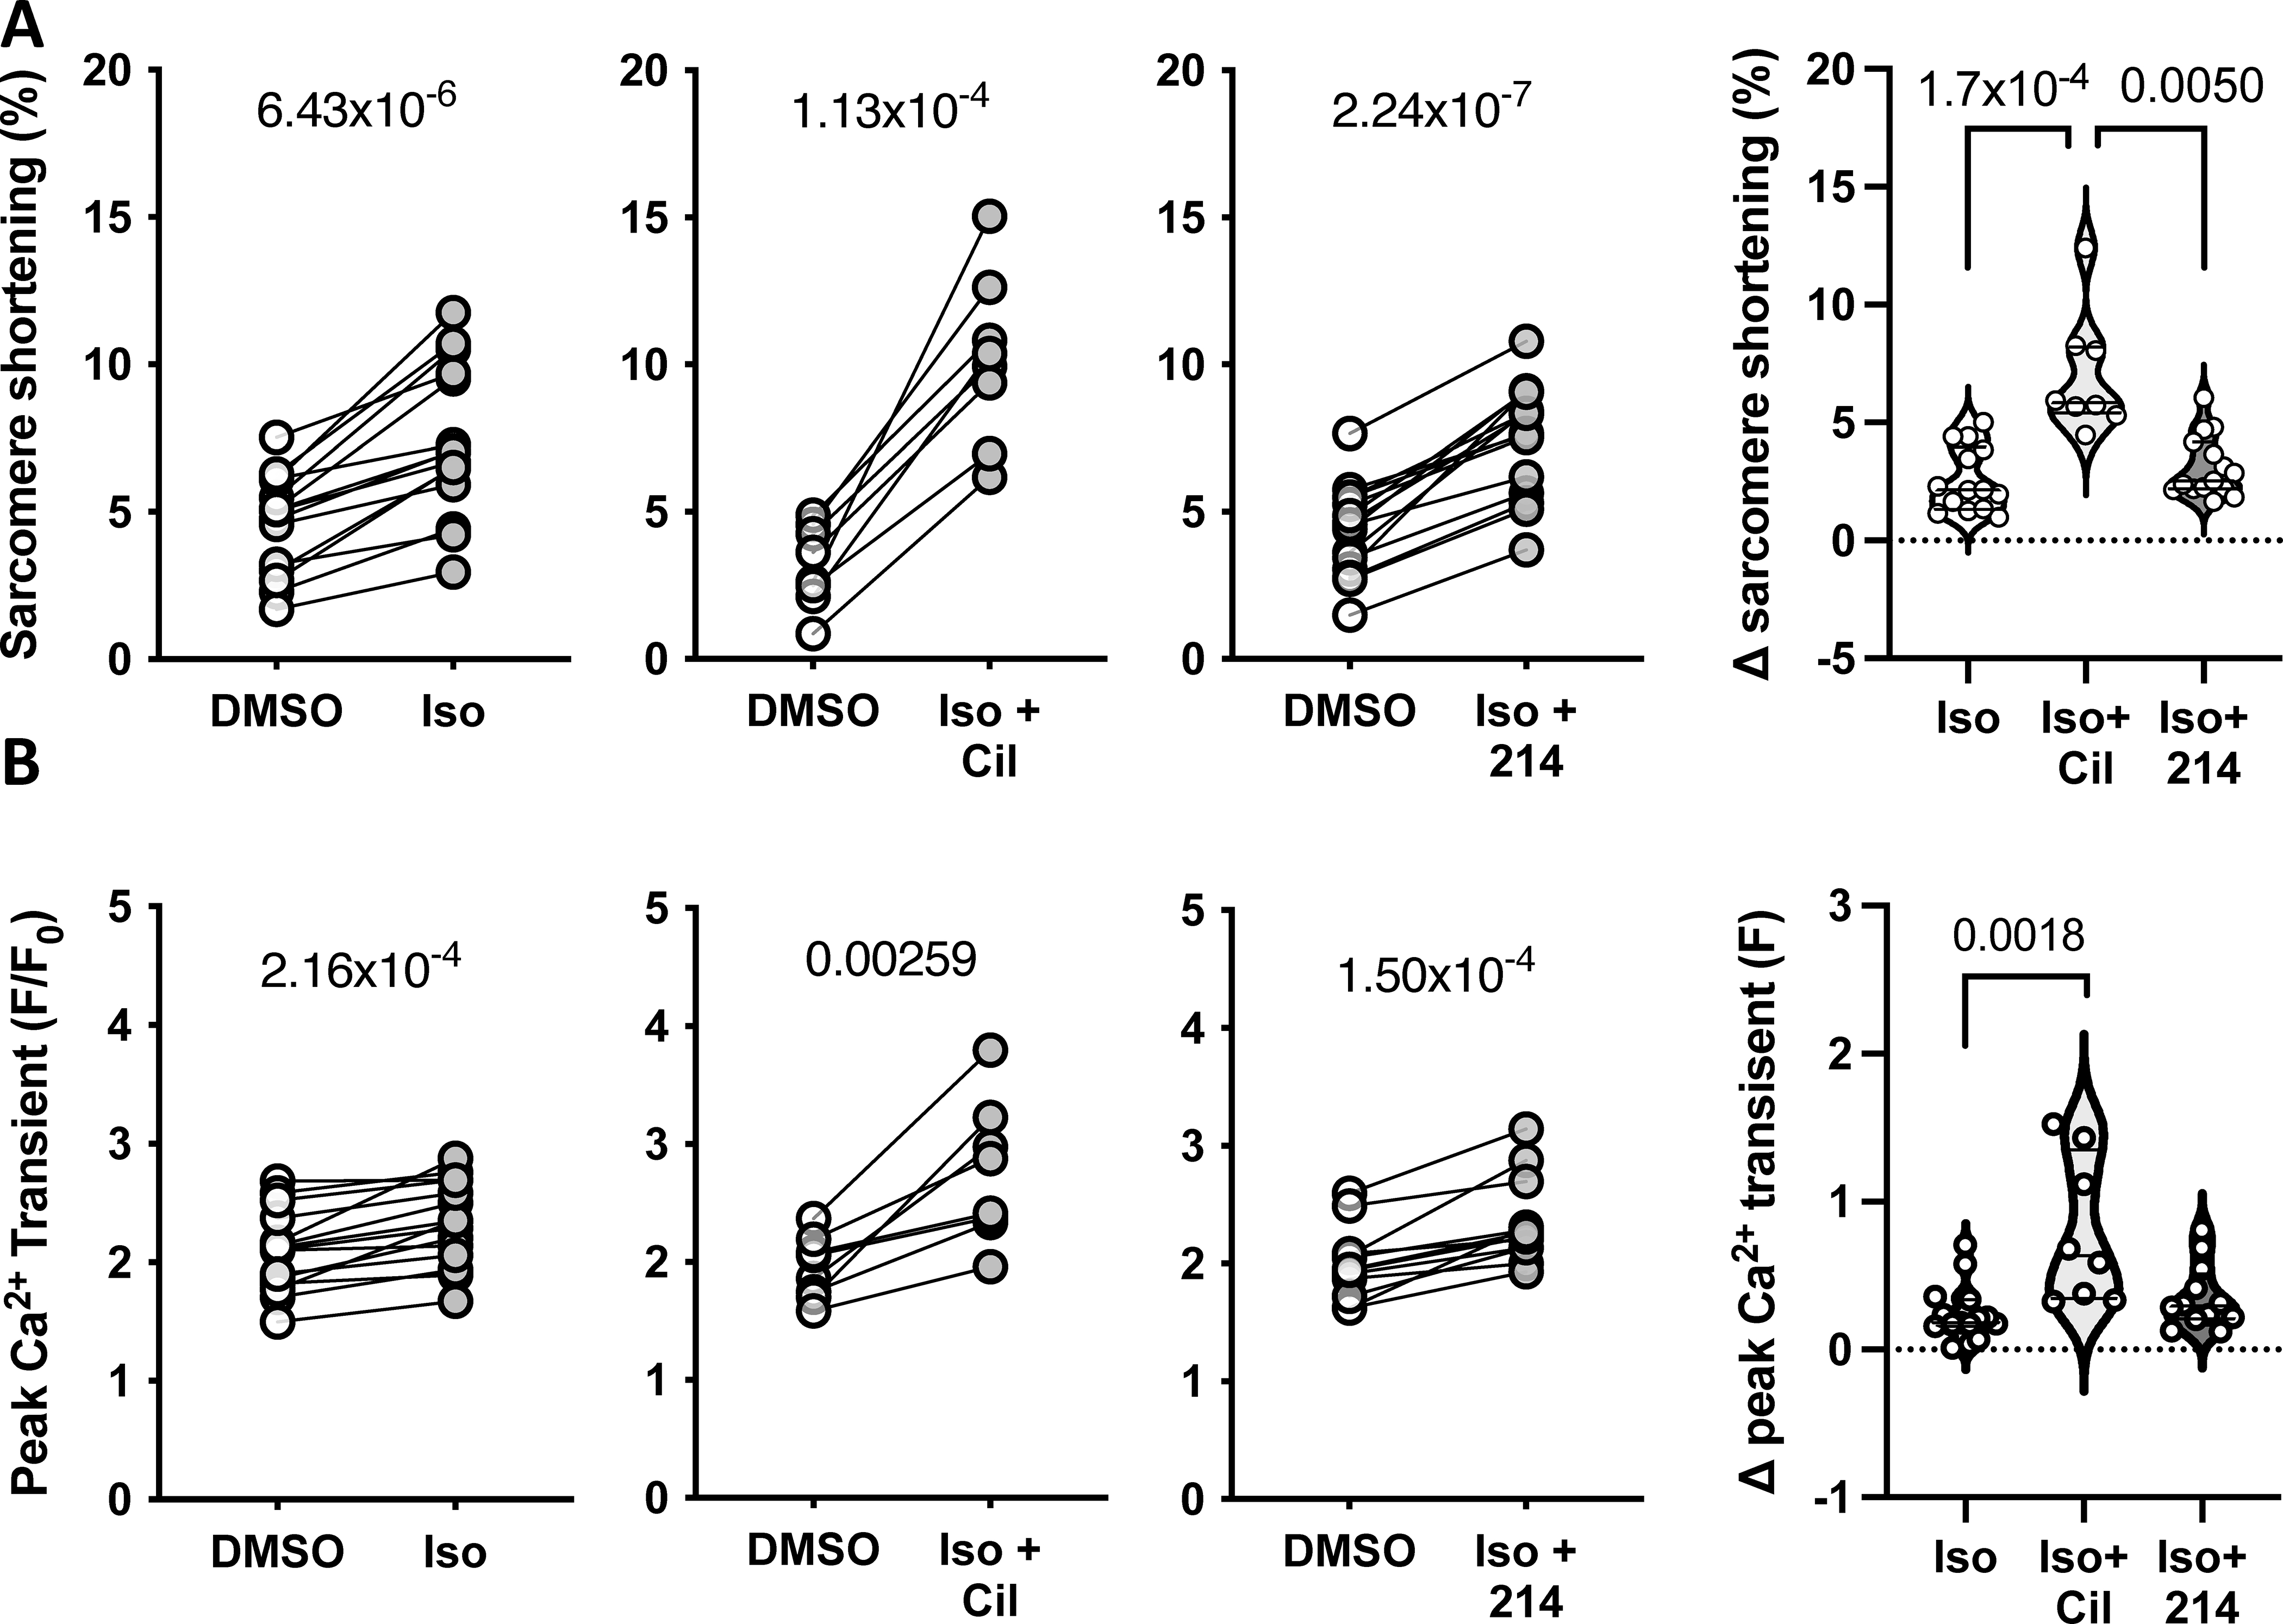
Figure 2. PDE1-i vs PDE3-i modulation of β-AR-stimulated signaling.

Guinea pig myocytes were treated with sub-maximal isoproterenol (Iso; 0.025nM) alone, or with Cil or 214. Changes in the peak A) sarcomere shortening and B) Ca2+ transients are plotted, with p-values indicating paired Student’s t-test results. The change from baseline is plotted to the right; P values are for a Kruskal-Wallis test with Dunn’s MCT.
