
Figure 3. Effects of PDE1i upon myofilament-Ca relationship and PKA-mediated phosphorylation of TnI or MYBP-C.
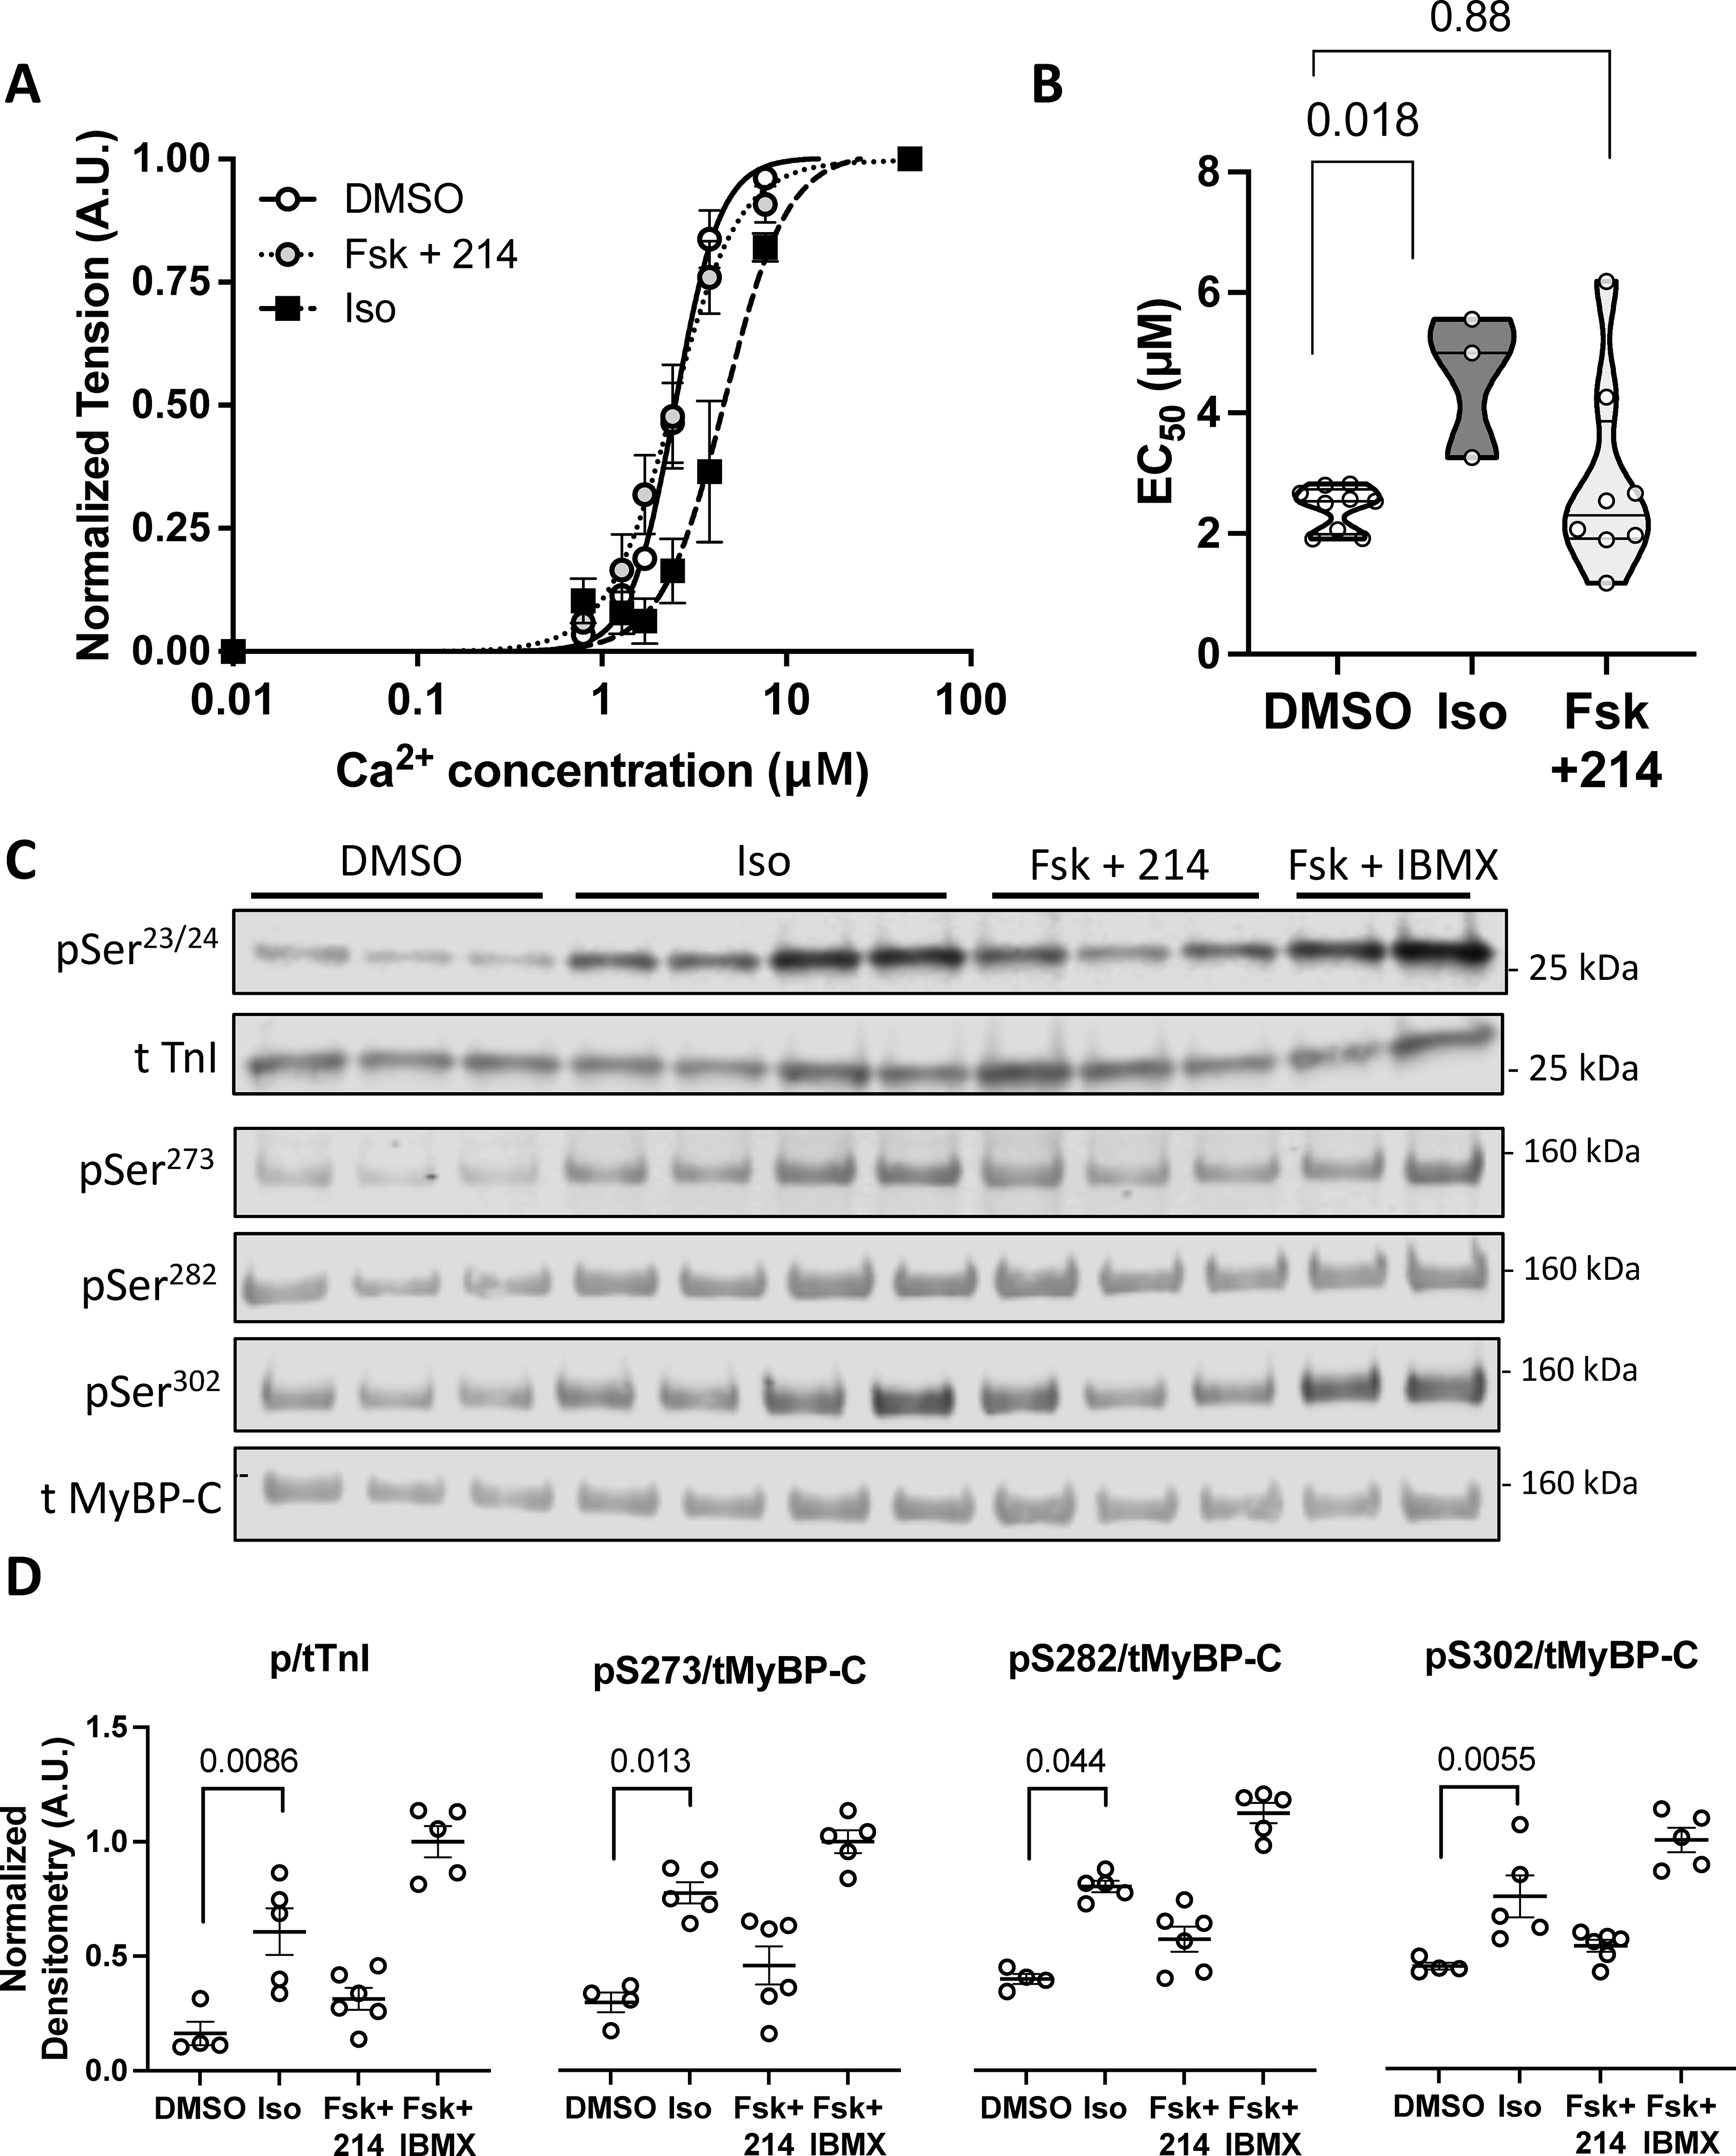
Guinea pig myocytes were treated with DMSO, Iso (50nM), or Fsk (10nM) + 214 (1μM) before being skinned. A) A normalized curve showing the myofilament force-pCa relationship; n=9, 9, 3. B) Summary EC50 (Ca2+ at 50% maximal activation) for each condition. P-values are Mann-Whitney U test with 2-comparison correction. C) Representative western blot of phosphorylated and total troponin I (TnI) at Ser23/24 or myosin binding protein-C (MyBP-C) at Ser273, Ser282 and Ser302 for myocytes treated as indicated. D) The phospho/total densitometry values as indicated were normalized to a maximal response from Fsk (25μM) + IBMX (100μM). Kruskal-Wallis test with Dunn’s MCT among DMSO, Iso and Fsk+214.