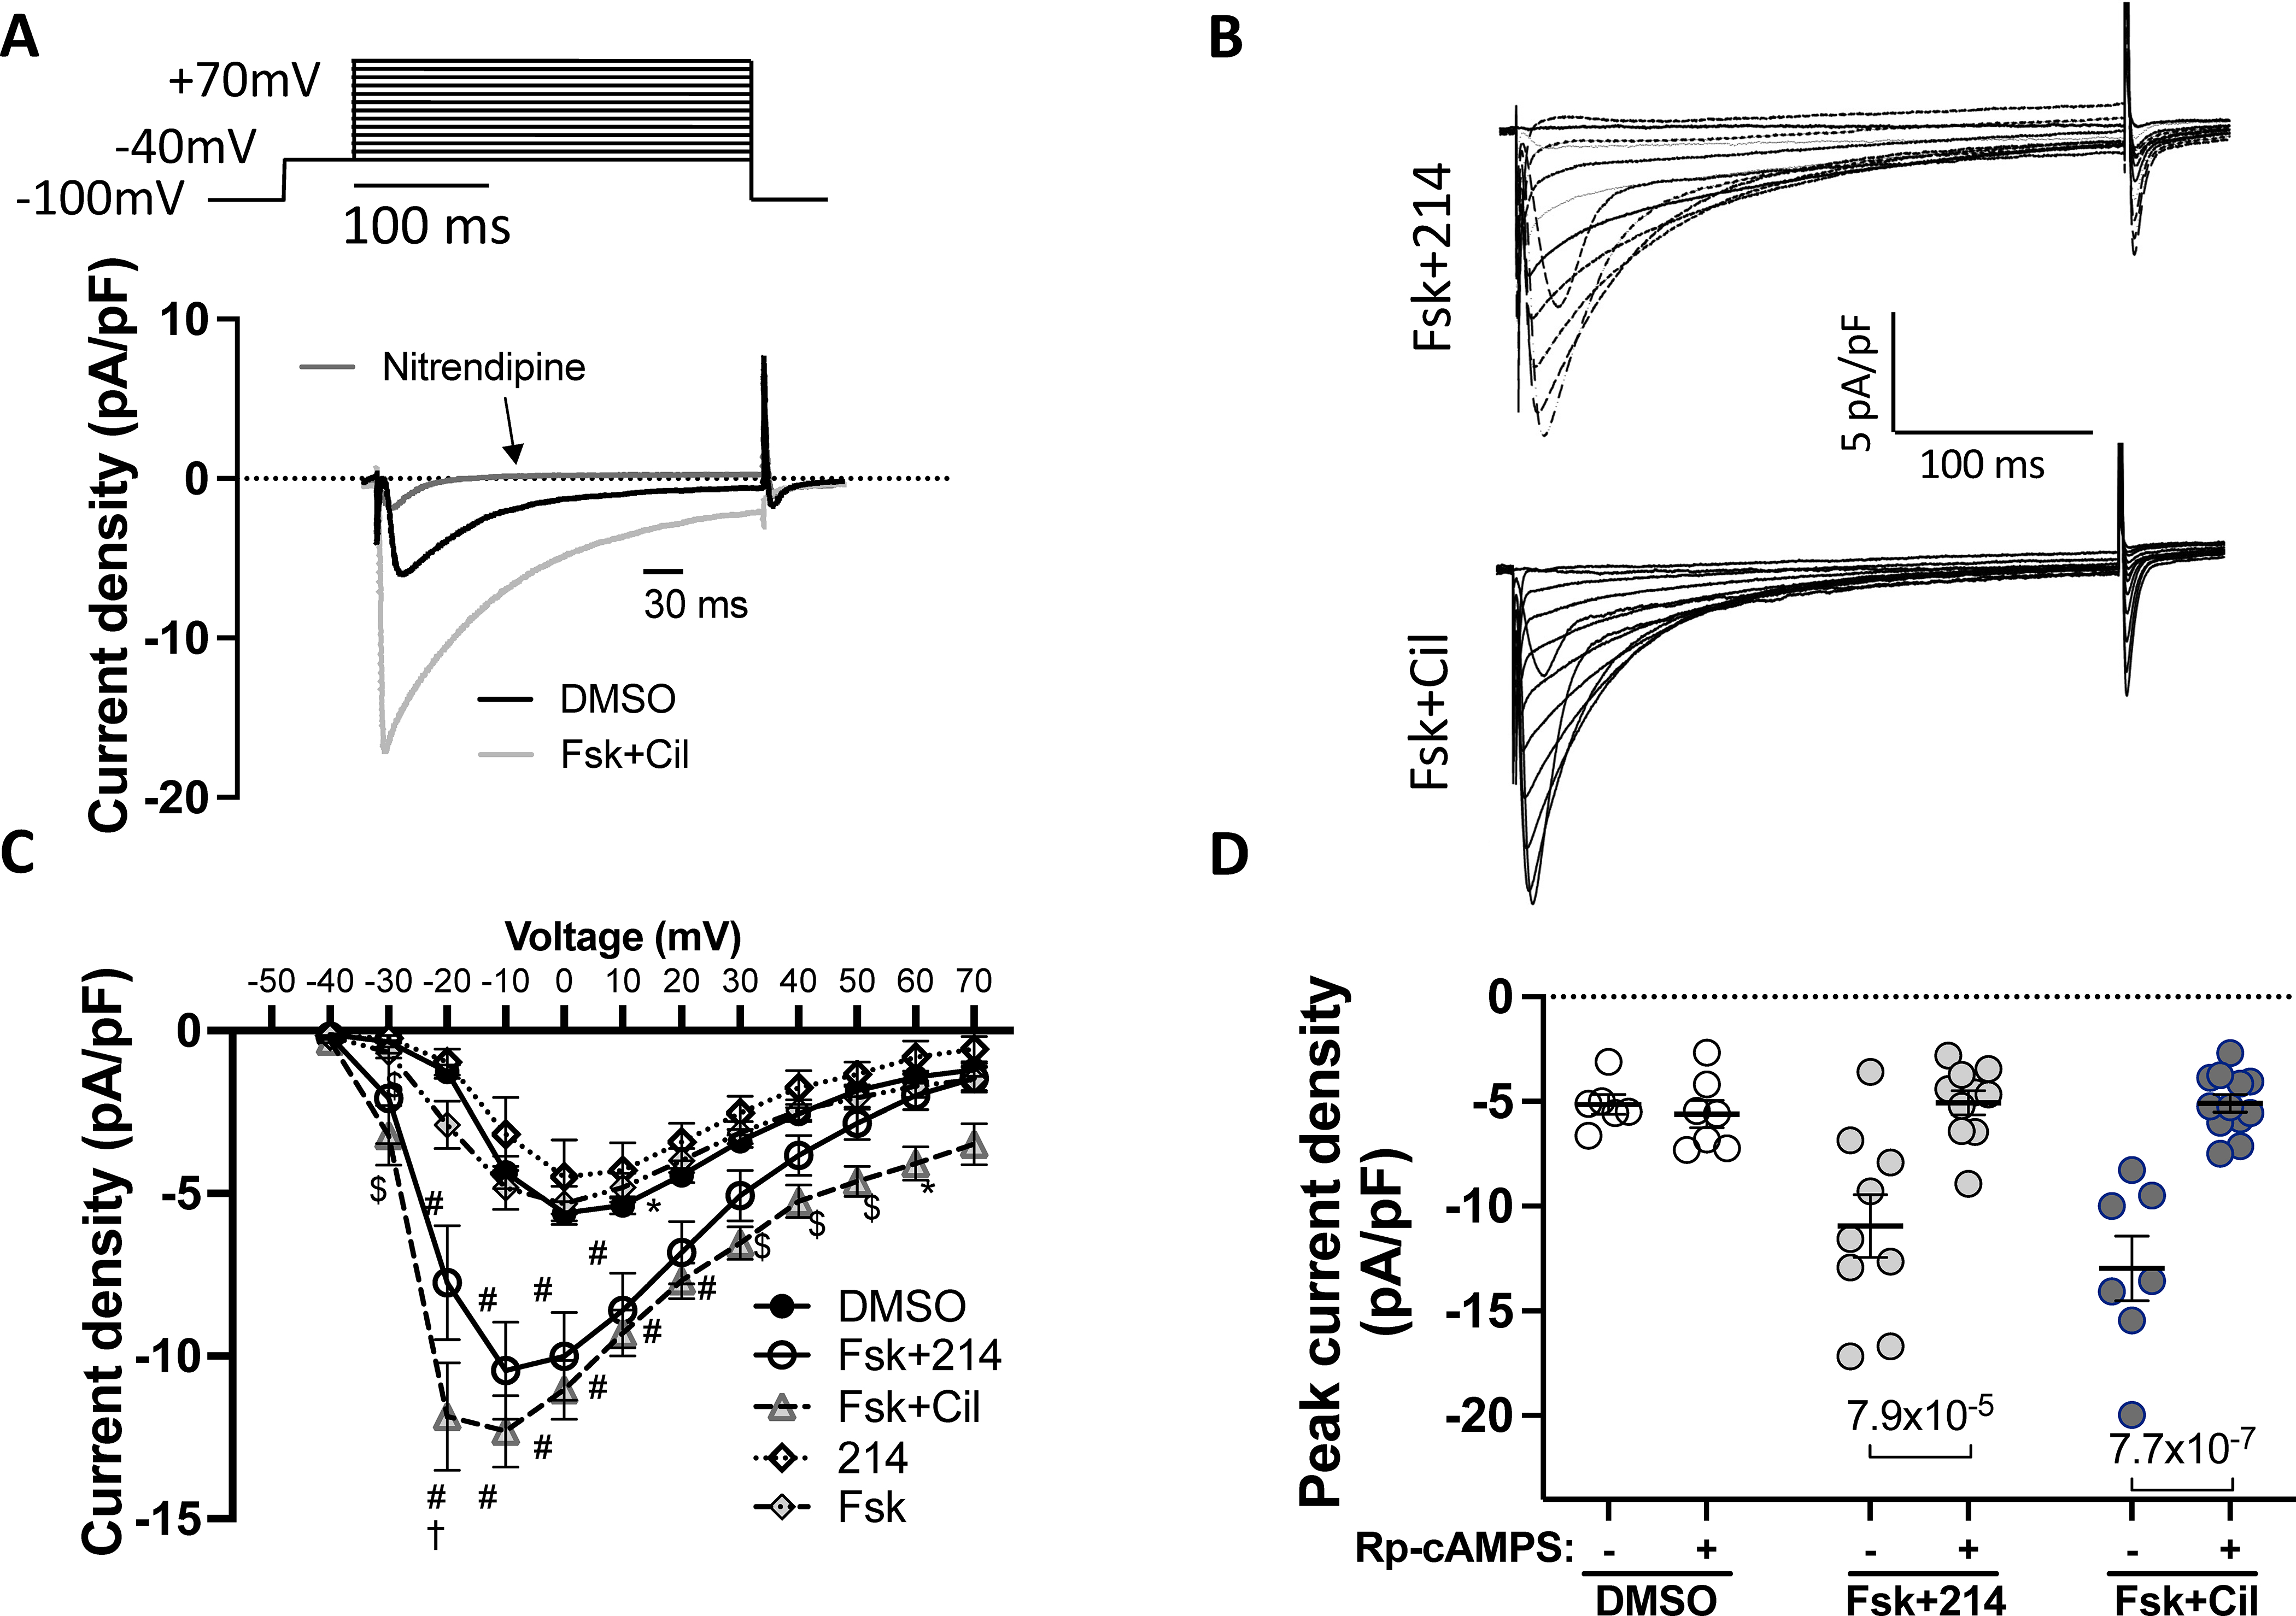
Figure 5. The L-type Ca2+ channel Cav1.2 current increases upon PDE1 or 3 inhibition.

Cells were stimulated with the indicated drugs, and the inward current measured using the whole-cell voltage clamp protocol. Nitrendipine (10μM) was used to confirm Cav1.2 as the primary source of the current. A) The voltage-clamp protocol with representative trace showing change upon Fsk+Cil treatment and sensitivity to nitrendipine. B) Representative current-time traces for Fsk+214 and Fsk+Cil. C) Averaged peak current density versus membrane voltage. *p<0.05, $p<0.001, #p<0.0001 against DMSO; †p<0.0001 against Fsk+214, ordinary 2-way ANOVA with Tukey’s MCT comparing DMSO vs Fsk+214 vs Fsk+Cil; see Online Table I for exact p values. D) The peak current density in cells stimulated with indicated drugs before or 8–10 minutes after dialysis with PKA inhibitor - Rp-cAMPS (100μM); ordinary 2-way ANOVA with Sidak’s MCT.
