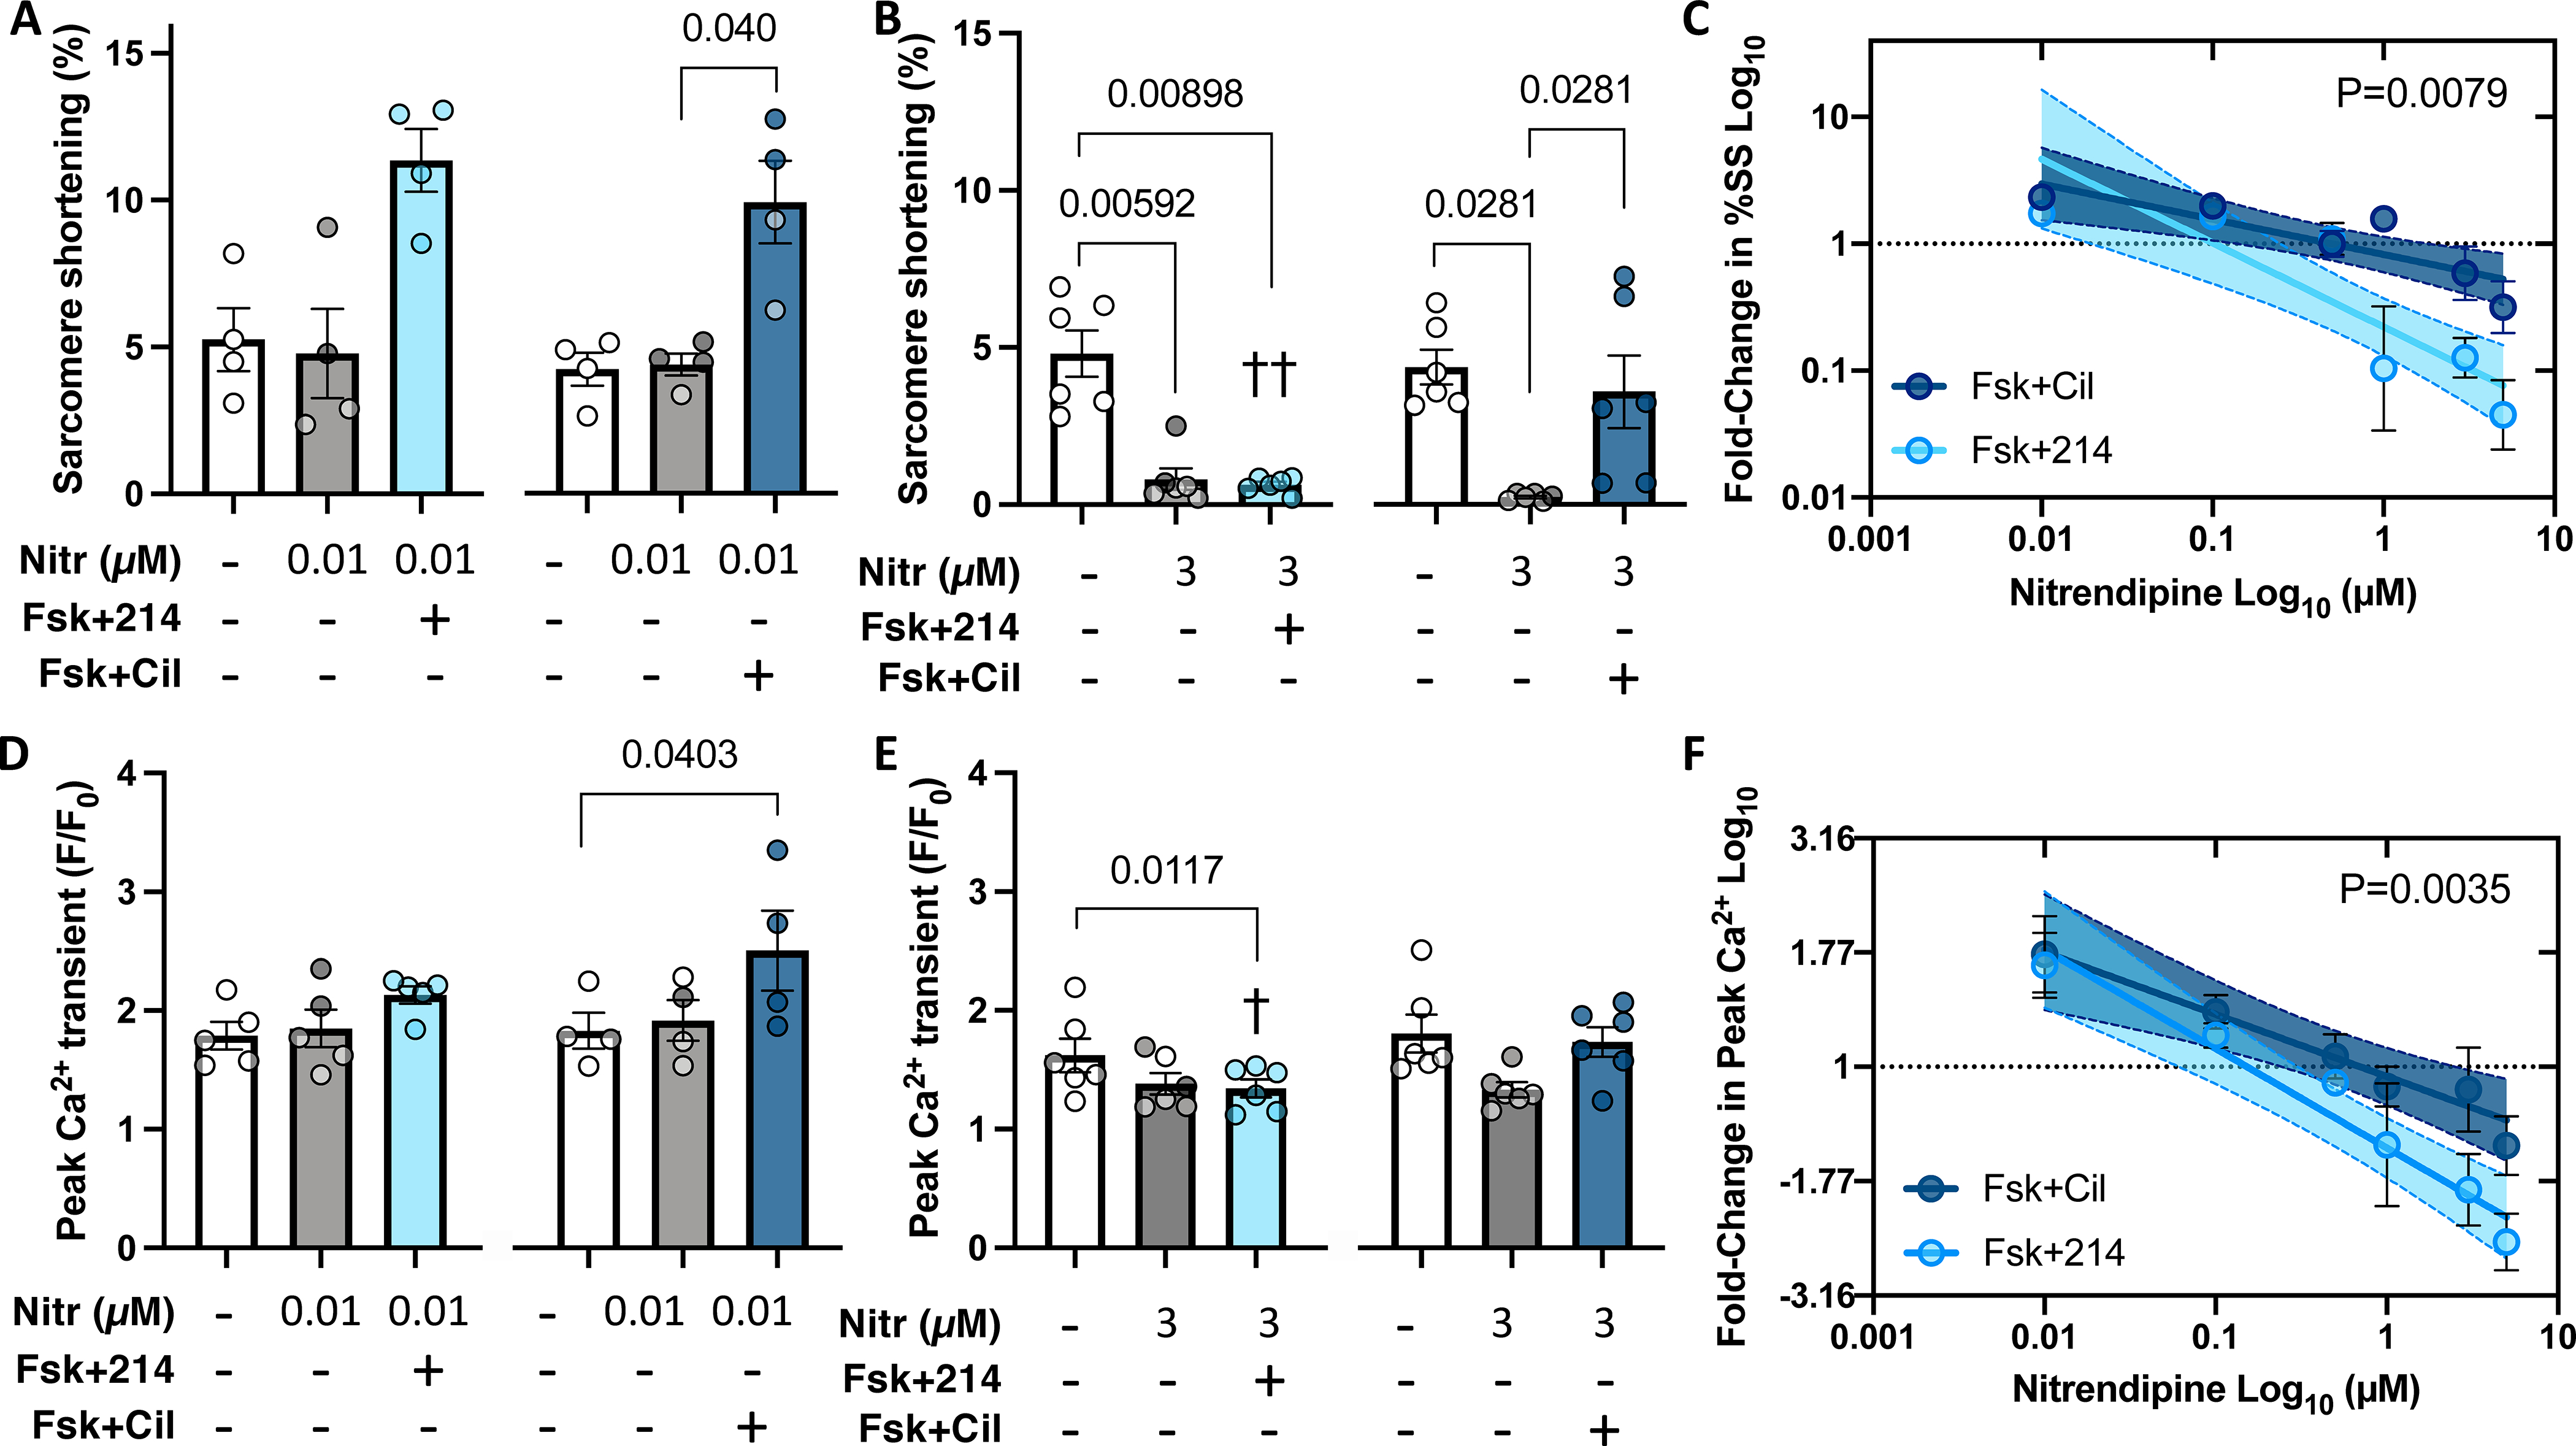
Figure 6. Positive inotropy from PDE1i has greater sensitivity to Cav1.2 blockade than that from PDE3i.

Myocytes were pre-treated with nitrendipine (Nitr) before further stimulation with Fsk+214 or Fsk+Cil. A,B) Sarcomere shortening with Nitr at either 0.01μM or 3 μM. P values in bar graphs from Friedman test with Dunn’s MCT within each 3-condition group between all pairs. C) Fold-change in sarcomere shortening (%SS) from PDE inhibitor versus DMSO alone plot versus Nitr dose on log-log scale. Linear fit and 95% CI values are shown. P-value for difference in slope of two relations by ANCOVA. D, E) Peak Ca2+ transient for same treatments shown in panels A and B, with same statistical test used. ††p=0.0048, †p=0.042 vs respective Nitr+Fsk+Cil group, RM 2-way ANOVA with Holm-Sidak’s post-hoc analysis, comparing Nitr ± Fsk+214 or ± Fsk+Cil. F) Fold change in peak Ca2+ versus Nitr dose for both PDE inhibitors plot and analyzed as in panel C. P value is difference in intercept.
