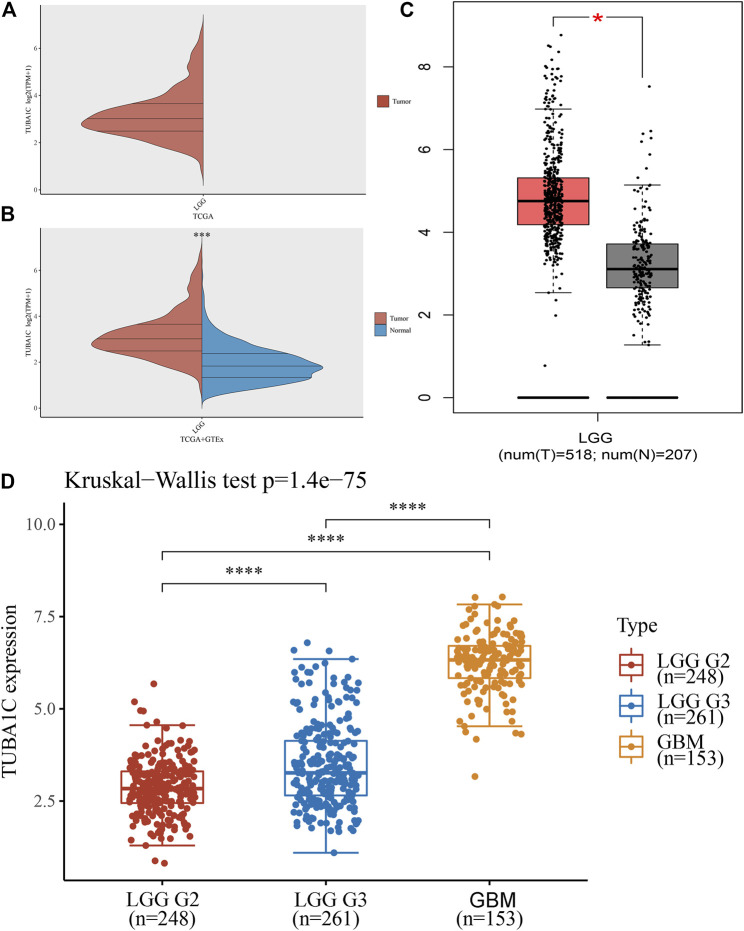
FIGURE 1.
The different mRNA expressions of TUBA1C in LGG, GBM, and normal tissues. (A,B) mRNA expressions of TUBA1C in LGG and normal tissues. (C) mRNA expression of TUBA1C in LGG and normal tissues in the GEPIA. (D) Differential TUBA1C expressions in tumor stages in LGG and GBM. *p < 0.05, ***p < 0.001, ****p < 0.0001.

