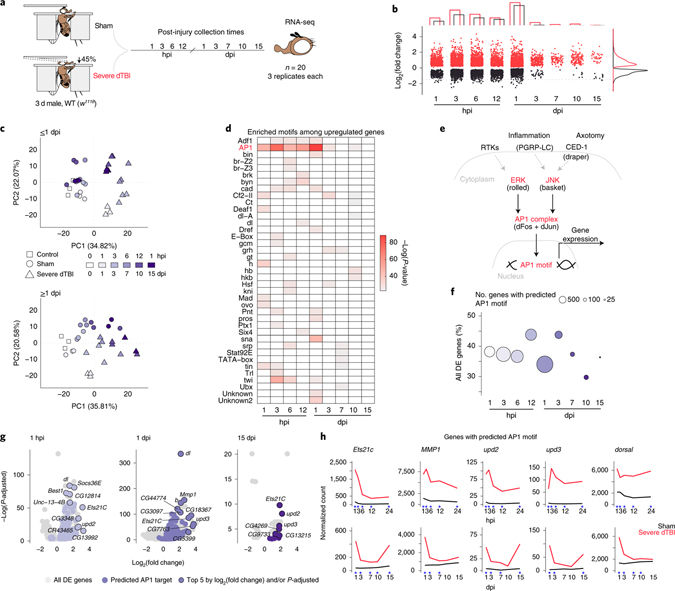
Fig. 1 |. A lasting AP1 transcriptional response to TBI.
a, Design of time course RNA-seq experiment. Sham and severe dTBI heads were collected at 1 pre-injury (0 hours per injury; hpi) and 9 post-injury timepoints, in 3 biological replicates (n = 20 heads per replicate) for each injury condition and time (n = 57 samples total). b, Plot showing the number of significantly differentially expressed genes (upregulated in red, downregulated in black) at each post-injury time. Bar graph annotation (top) summarizes the total number of genes up and down. Density plot annotation (right) summarizes the distribution by log2 fold change (each point = 1 gene; FDR < 0.05). c, Principal component analysis of ≤1 dpi (days post-injury; top) and ≥1 dpi samples (bottom). Each point represents 1 biological replicate. Shape encodes condition. Color encodes post-injury time. d, Tile plot showing results of HOMER de novo motif enrichment analysis among upregulated genes (FDR<0.05). Presence of a colored tile indicates motif enrichment at a given post-injury time. Tile color encodes significance. e, Regulation of the conserved transcriptional complex AP1. Drosophila-specific gene names in parenthesis. f, Summary of the proportion of all differentially expressed genes with a predicted AP1 motif. Color key as in c. g, Volcano plots highlighting genes with predicted AP1 motifs (purple points), with the top 5 genes by L2FC and/or p-adjusted labelled. h, Average sham (black) and severe dTBI (red) expression of highly affected AP1 target genes at ≤1 dpi (top) and ≥1 dpi (bottom; blue star indicates FDR < 0.05 at a given time). See Supplementary Table 1 for genotypes in all figures.

