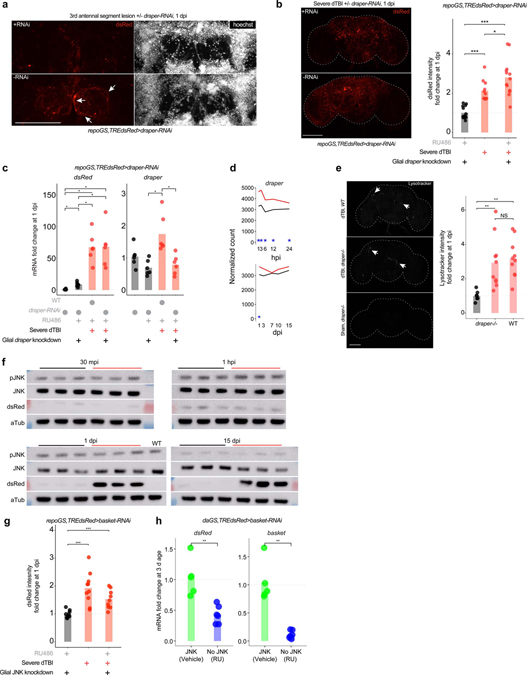
Extended Data Fig. 3 |. Glial AP1 activation is draper and JNK-independent.
a, Representative z-stack of the first 6 slices (2 μm each) of the antennal lobe in flies with (RU; top) and without (vehicle; bottom) draper-RNAi in glia. White arrows highlight hypertrophic glial processes. Image shown is 1 day after 3rd antennal segment ablation (abbreviated AL injury; images are representative of n = 7 – 9 brains per condition). b, Left, representative z-stacked whole mount brains at 1 day post-dTBI with (RU; top) and without (vehicle; bottom) draper-RNAi in glia. Right, quantification of dsRed immunofluorescence fold change, relative to left most condition (each point = 1 brain; n = 11 – 14 brains per condition pooled from two independent experiments; p = 2.17e-06, Kruskal–Wallis test with Wilcoxon rank sum test). c, Mean relative expression of dsRed and draper mRNA by RT-qPCR at 1 dpi, with or without glial draper-RNAi (each point = 1 biological replicate, 9 dissected brains; n = 6 biological replicates per condition; Kruskal–Wallis test with Dunn’s multiple comparison test and Holm adjustment). d, Average sham (black) and severe dTBI (red) expression of draper from RNAseq experiment at ≤1 dpi (top) and ≥1 dpi (bottom; blue star indicates FDR < 0.05 at a given time). e, Representative whole mount IF for lysotracker signal at 1 dpi after severe dTBI in WT (top; w1118) and draper−/− flies (middle: dTBI; bottom: sham). Right, quantification of lysotracker immunofluorescence fold change, relative to left most condition (each point = 1 brain; n = 7 – 11 brains per condition pooled from two independent experiments; p = 0.00072, Kruskal–Wallis test with Dunn’s multiple comparison test and Holm adjustment). f, Western immunoblots for all replicates of Fig. 4a. Samples are biological replicates. WT is w1118. g, Quantification of dsRed immunofluorescence fold change for representative whole mount brains shown in Fig. 4b, relative to left most condition (each point = 1 brain; n = 9–10 brains per condition pooled from two independent experiments; p = 0.000238, Kruskal–Wallis test with Wilcoxon rank sum test). h, Mean relative expression of basal dsRed and basket mRNA by RT-qPCR in 3 d old whole flies, with (blue) or without JNK (green) RNAi expressed under a ubiquitous driver, daughterlessGeneSwitch (each point = 1 biological replicate, 20 whole flies; Student’s t-test).
a-g, Black symbols, sham Red symbols, severe dTBI. Statistical annotations are ****p<0.0001, ***p<0.001, **p<0.01, *p<0.05. All scale bars 100μm. See Supplementary Table 1 for genotypes.

