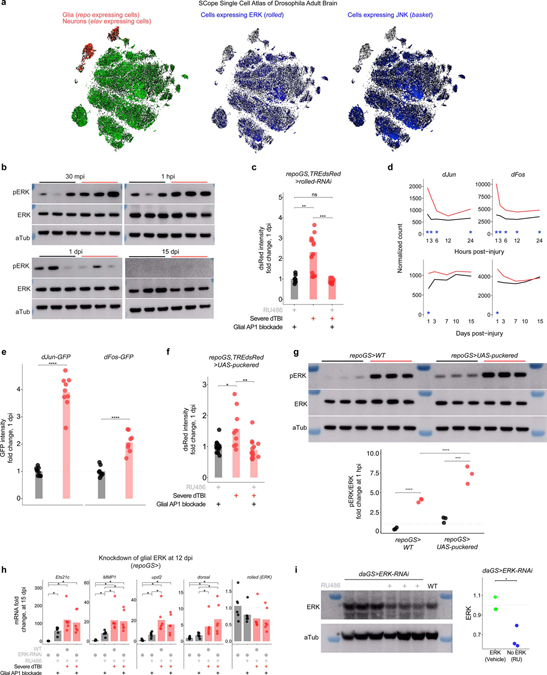
Extended Data Fig. 4 |. AP1 activation requires ERK.
a, Images from Scope Single Cell Atlas of the Drosophila adult brain showing relative expression levels of repo, elav, rolled (ERK), and basket (JNK). ERK is detected in a greater proportion of repo+ cells than JNK. b, Western immunoblots for all replicates of Fig. 4c. Samples are biological replicates. Genotype is TREdsRed. c, Quantification of dsRed immunofluorescence fold change for representative whole mount brains shown in Fig. 4d, relative to leftmost condition (each point = 1 brain; n = 9–15 brains per condition pooled from two independent experiments; p = 6.08e-7, one-way ANOVA with Tukey’s test). d, RNAseq data showing average sham (black) and severe dTBI (red) expression of dFos and dJun at ≤1 dpi (top) and ≥1 dpi (bottom; blue star indicates FDR < 0.05 at a given time). e, Quantification of dJun-GFP (left) and dFos-GFP (right) immunofluorescence fold change for representative whole mount brains shown in Fig. 4e and 4f, relative to sham (each point = 1 brain; n = 7–10 brains per condition pooled from two independent experiments; Student’s t-test for each genotype). f, Quantification of dsRed immunofluorescence fold change for representative whole mount brains shown in Fig. 4g, relative to leftmost condition (each point = 1 brain; n = 9–15 brains per condition pooled from two independent experiments; p = 0.0040, one-way ANOVA with Tukey’s test). g, Glial expression of the MAPK phosphatase, puckered, does not reduce pERK levels at 1 hpi. Left, full western blots. Right, quantification of pERK/ERK ratio by western immunoblot (each point = 1 biological replicate, 8 dissected brains; n = 3 biological replicates per condition/genotype; p = 0.0159, two-way ANOVA). h, Mean relative expression of AP1 target genes by RT-qPCR at 15 dpi, with or without ERK knockdown in glia via RNAi beginning at 12 dpi (each point = 1 biological replicate, 9 dissected brains; n = 6 biological replicates per condition; Kruskal–Wallis test with Dunn’s multiple comparison test and Holm adjustment). i, Western immunoblot for ERK protein in whole flies with (blue) or without (green) ERK-RNAi expressed under an inducible ubiquitous promoter (daughterless-geneSwitch). Right, quantification (each point = 1 biological replicate, 8 whole flies; Student’s t-test).
b-h, Black symbols, sham. Red symbols, severe dTBI. Statistical annotations are ****p<0.0001, ***p<0.001, **p<0.01, *p<0.05. See Supplementary Table 1 for genotypes.

