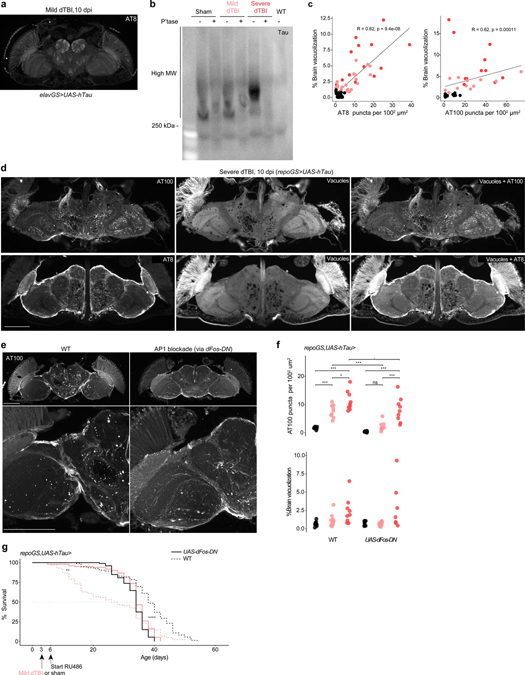
Extended Data Fig. 6 |. Sustained glial AP1 activity drives human tau pathology.
a, Representative section of paraffin-embedded head at 10 dpi stained for AT8 when human tau is expressed in neurons (representative of n = 7 animals). b, Membrane immunostained for human tau in phosphatase treated (+) and untreated (−) protein samples isolated from the heads of 5 dpi (repoGS>0N4R) or WT (w1118) flies (n = 30 per sample). c, Spearman correlation between percentage of total brain area vacuolized and number of AT8+ puncta (top) or AT100+ puncta (bottom) at 5 and 10 dpi (combined) in sham, mild or severe dTBI. Data shown is an alternative representation of Fig. 6a. d, Representative sections of paraffin embedded heads immunostained for AT100 (top row) or AT8 (bottom row), highlighting the concentration of phosphorylated tau puncta in neuropil and around vacuoles. Vacuoles are visualized by autofluorescence. e, Representative z-stacked hemisections of paraffin-embedded in WT (left; w1118) or AP1 blocked (right) mild dTBI at 10 dpi, immunostained for AT100. AP1 was blocked by expressing a dominant negative variant of dFos (dFos-DN). f, Quantification of AT00+ puncta (top) and % brain vacuolization (bottom) at 10 dpi with (UAS-dFos-DN) or without AP1 blockade (WT) in glia from 3 dpi (each point = 1 brain, n = 9–10 per condition/genotype pooled from two independent experiments; AT100: p=0.051, brain vacuolization: p=0.072, two-way ANOVA with Tukey’s test). g, Post-injury survival with (solid) or without (dashed) dFos-DN expression in glia in the setting of tau expression (n = 100 per condition, 5 vials of 20 flies; p < 0.0001, Kaplan-Meier analysis with log-rank comparison).
Black symbols, sham. Pink symbols, mild dTBI. Red symbols, severe dTBI. Statistical annotations are ****p<0.0001, ***p<0.001, **p<0.01, *p<0.05. All scale bars 100μm. See Supplementary Table 1 for genotypes.

