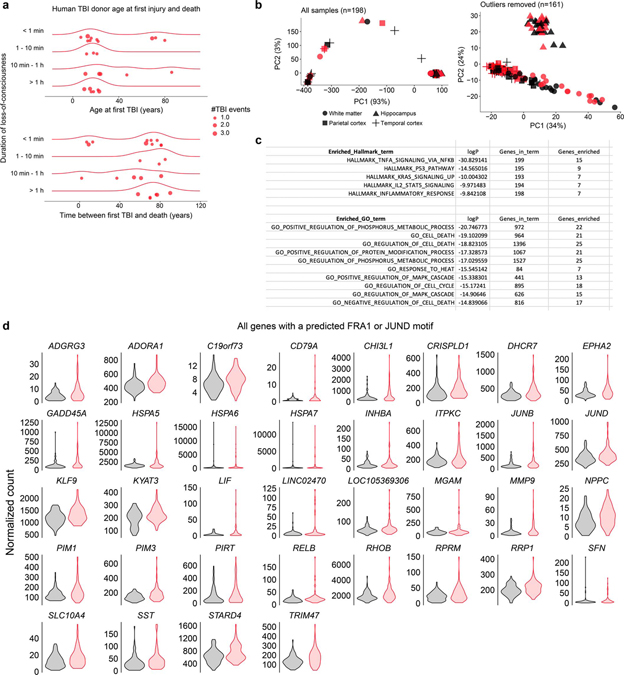
Extended Data Fig. 7 |. Evidence of AP1 activity decades after moderate human TBI.
a, TBI exposure history for donors; the same data is visualized two ways. Top shows age at first TBI, with most injuries occurring before age 30. Donors are further separated by duration of loss-of-consciousness. Total lifetime TBI events for each donor are shown by point size. Bottom shows the duration of time between first TBI and death. b, PCA of all samples (left) compared PCA of samples with outliers removed (right). Each point represents 1 tissue sample. Shape encodes brain region. Black symbols, non-TBI samples. Red symbols, TBI samples. c, Top 5 Molecular Signature Data Base (MSigDb) Hallmark gene sets and top 10 gene ontology (GO) terms enriched among upregulated genes (FDR<0.10) in TBI donors. d, Violin plots showing expression of all predicted FRA1/JUND genes in non-TBI (black; n samples = 81) and TBI (red; n samples = 80) exposed donors (FDR < 0.10).

